
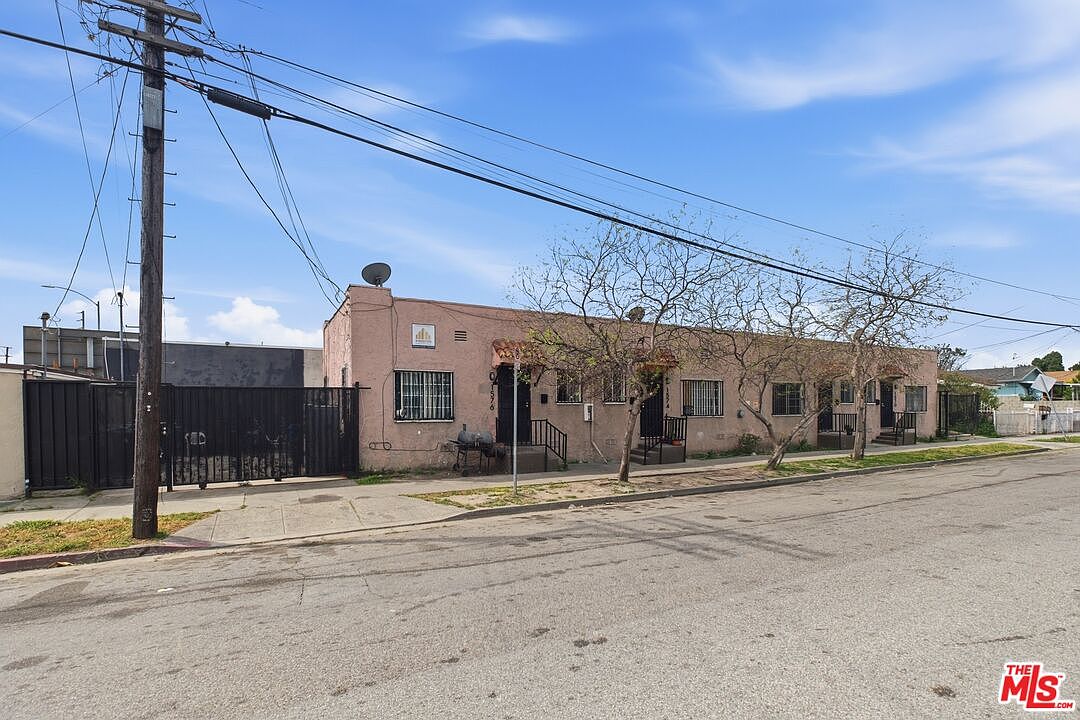


1570 E 110th St, Los Angeles, CA, 90059
About This Home
This well maintained 5 unit, mixed use property is the perfect entry level commercial investment. Featuring (4) One bedroom, one bathroom units (1) small retail unit and (2) oversized, fully-gated one car driveways. With one being at each end of the property. This property is uniquely located on a wide, corner lot, consisting of two detached buildings, making the retail unit and 4 residential units entirely separate. This offers both prime frontage for the retail unit along side a sense of privacy for the residential units. The retail unit was once a to-go, food business, then a snack stand and is currently used as storage. The commercial retail unit and (1) residential unit will be delivered vacant; offering access to immediate upside in rents. The Watts area is under rapid re-development including recent building of Freedom Plaza to compliment the rebuilding 100s of new units at the Jordan Downs Housing Complex. The nearby Nickerson Gardens and Imperial Courts are slated for similar development as well, furthering the economic activity in the area and providing much needed housing. Located just minutes away from Downtown Los Angeles with close proximity to 105, 110, 710 and 605 Freeways; making it ideal for transit to area employers and attractions. Contact me today to set up your showings or with any questions! With two units delivered vacant, you can easily achieve a near 8.5% cap rate and a 9.5 GRM to CASH FLOW! Additionally, the adjacent property at 11003 Compton Ave is listed for sale at the same time, offering the chance to assemble both properties. See MLS Listing #26665505 for more information.
Getting Around
 Somewhat Walkable
 Good Transit
 Bikeable
Schools
Construction
Condition
- Year built: 1927
Materials
- Roof: Flat
Type & Style
- Home type: MultiFamily
- Property subType: Multi Family
Interior
Appliances
- Laundry features: None
Bathroom
- Features: Shower and Tub
Bedrooms & Bathrooms
- Bedrooms: 4
- Bathrooms: 5
Features
- Built-Ins
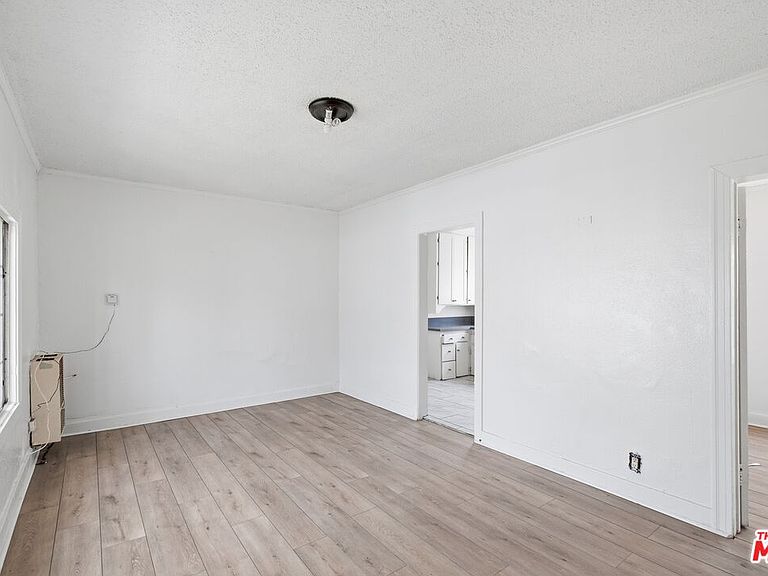
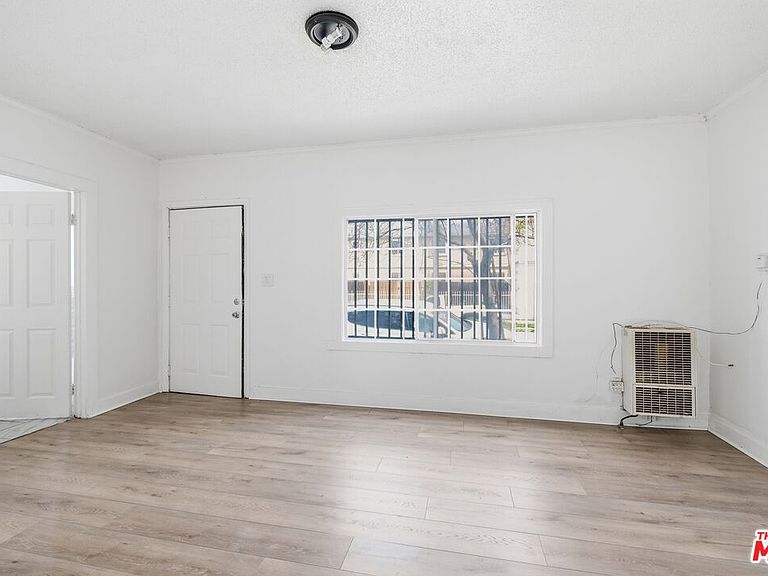
- Flooring: Laminate,Ceramic Tile
- Fireplace features: None
Heating & Cooling
- Heating features: Forced Air,Wall
- Cooling features: None
Interior Area
- Total structure area: 2,052
- Total interior livable area: 2,052 sqft
Kitchen
- Features: Pantry
Property
Details
- Parcel number: 6070008015
- Zoning: LAR2
- Special condition: Standard
Features
- Levels: One
- Stories: 1
- Pool features: None
- Patio & porch: Porch,Front Porch,Rear Porch
- Spa features: None
- Has view: Yes
- View description: None
- Waterfront features: None
Lot
- Lot size: 4,159 sqft
Parking
- Total spaces: 2
- Parking features: Driveway,Concrete
- Has uncovered spaces: Yes
- Uncovered spaces: 2
Climate Risk is Financial Risk
Every home has a financial story beyond the listing price. Below, you’ll see the climate risks that could affect this property — and in Bills & Affordability, how those risks may influence repairs, insurance, utilities, and long-term value.
Biggest Threats for This Home
- Earthquake

- Inland Flooding

- Heat Wave

- Wildfire

How This Home’s Risks Compare
FEMA Declared Disasters in Los Angeles County and California
Understanding the Costs
Financial advisors generally recommend spending no more than 30% of your gross household income on housing costs. In practice, many households stretch to 35% or beyond — especially in high-cost markets.
Estimated Costs Today
| Monthly | Annual | |
|---|---|---|
| Mortgage | $4,298 | $51,576 |
| Home Insurance * | $150 | $1,800 |
| Property Taxes | $878 | $10,536 |
| Electricity | $440 | $5,280 |
| Total | $5,766 | $69,192 |
Income You'd Need if You Spent...
California FAIR Plan Programs
How Costs Could Change Over Time
Climate risk is quickly impacting all of the major home ownership costs. Adjust the growth rates and percentage of income spent on housing below to see how your housing costs could change over the next 10 years — and what income you'd need to keep up.
Comparing Against the Market
Price Per Sq Ft
vs Other Active Listings
Avg $/sqft
vs Homes Sold Last Month
Median $/sqft
Current Market Trends
Median Price Per Square Foot
The median price per square foot of homes sold in this area each month. Compare this to this listing's price per square foot to gauge whether the home is priced in line with recent sales.
Historicals for This Listing
Zestimate History ($/sqft)
Price History
| Date | Event | Price |
|---|---|---|
| 2026-04-21 | Listed for sale | $849,999 |
| 2021-10-13 | Sold | $805,000 |
| 2021-01-20 | Listing removed | -- |
| 2021-01-18 | Listed for sale | $895,000 |
| 2019-07-12 | Sold | $725,000 |
| 2018-09-07 | Sold | $380,000 |
| 2015-10-05 | Sold | $270,000 |
 View on Zillow