


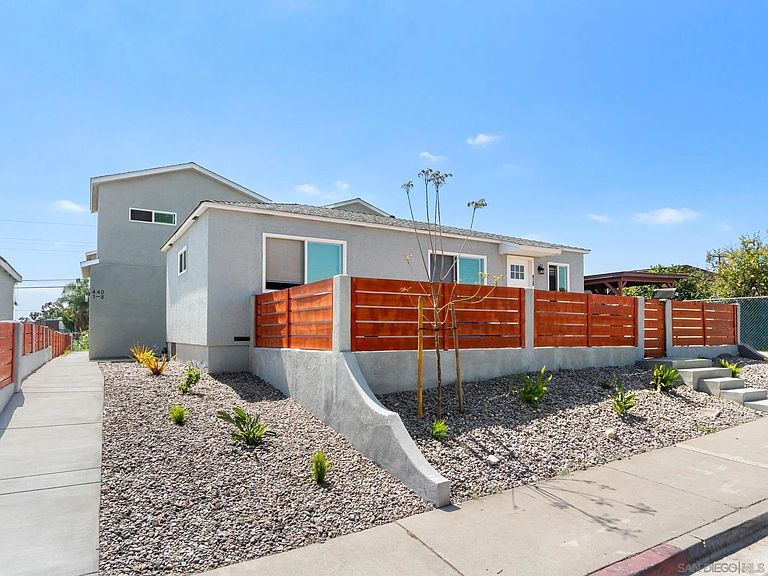

438 Denby St, San Diego, CA, 92102
About This Home
We're pleased to present 438 Denby Street; a fully stabilized turn-key multifamily offering comprised of nine units on five detached structures. The property consists of one fully remodeled detached single-family home and eight brand-new construction units in the rear completed in 2026. The property totals approximately 4,415 rentable square feet on a 6,573-square-foot parcel. Featuring a solid 6% entry CAP. What distinguishes this offering is that it is already fully stabilized: generating $19,600 of monthly income and $235,200 of annual gross. There is no lease-up, renovation, or rent-repositioning risk left to execute - a buyer steps into durable, day-one cash flow at delivery. Eight of the nine units are AB 1482 exempt from rent control limitations. All utilities are sub-metered, shifting utility costs to residents. The unit mix pairs the remodeled detached 2-bed/1-bath home at $2,925, one - 2-bed/1-bath unit at $2,500 and seven 1-bed/1-bath units averaging $2,025 monthly. Brand-new construction, separately metered utilities, and market-rate rents already in place combine to offer a low-friction, institutionally clean core asset. The property is centrally located within minutes to Downtown San Diego, Coronado, Golden Hill, North Park and some of San Diego's most desireable attractions including PETCO Park, San Diego Zoo and Balboa Park. The region is quickly gentrifying making this an attractive investment opportunity for years to come and a great addition to any portfolio.
Getting Around
 Somewhat Walkable
 Good Transit
 Somewhat Bikeable
Schools
Construction
Type & Style
- Home type: MultiFamily
- Property subType: Multi Family
Interior
Bedrooms & Bathrooms
- Bedrooms: 11
- Bathrooms: 9
- Full bathrooms: 9
Cooling
- Cooling features: Wall/Window
Interior Area
- Total structure area: 4,415
- Total interior livable area: 4,415 sqft
Property
Details
- Parcel number: 5471021300
Features
- Levels: 2 Story
- Stories: 2
Climate Risk is Financial Risk
Every home has a financial story beyond the listing price. Below, you’ll see the climate risks that could affect this property — and in Bills & Affordability, how those risks may influence repairs, insurance, utilities, and long-term value.
Biggest Threats for This Home
- Earthquake

- Heat Wave

- Wildfire

How This Home’s Risks Compare
FEMA Declared Disasters in San Diego County and California
Understanding the Costs
Financial advisors generally recommend spending no more than 30% of your gross household income on housing costs. In practice, many households stretch to 35% or beyond — especially in high-cost markets.
Estimated Costs Today
| Monthly | Annual | |
|---|---|---|
| Mortgage | $14,158 | $169,896 |
| Home Insurance * | $435 | $5,220 |
| Property Taxes | $3,177 | $38,124 |
| Electricity | $946 | $11,360 |
| Total | $18,716 | $224,592 |
Income You'd Need if You Spent...
California FAIR Plan Programs
How Costs Could Change Over Time
Climate risk is quickly impacting all of the major home ownership costs. Adjust the growth rates and percentage of income spent on housing below to see how your housing costs could change over the next 10 years — and what income you'd need to keep up.
Comparing Against the Market
Price Per Sq Ft
vs Other Active Listings
Avg $/sqft
vs Homes Sold Last Month
Median $/sqft
Current Market Trends
Median Price Per Square Foot
The median price per square foot of homes sold in this area each month. Compare this to this listing's price per square foot to gauge whether the home is priced in line with recent sales.
Historicals for This Listing
Zestimate History ($/sqft)
Price History
| Date | Event | Price |
|---|---|---|
| 2026-07-08 | Listed for sale | $2,800,000 |
| 2026-06-24 | Listing removed | $2,925 |
| 2026-05-28 | Listed for rent | $2,925 |
| 2024-08-28 | Listing removed | $2,800 |
| 2024-08-09 | Listed for rent | $2,800 |
| 2024-04-04 | Sold | $600,000 |
| 2001-02-21 | Sold | $144,000 |
 View on Zillow