

281 23rd St, Brooklyn, NY, 11215
About This Home
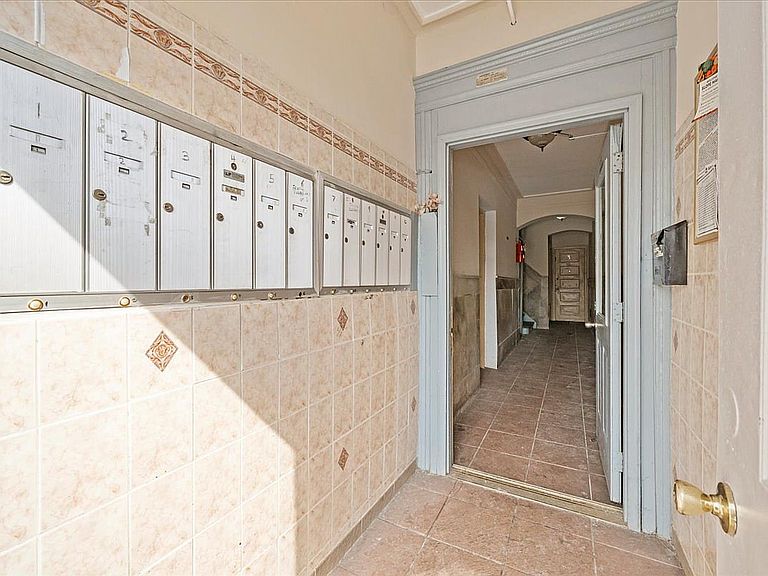
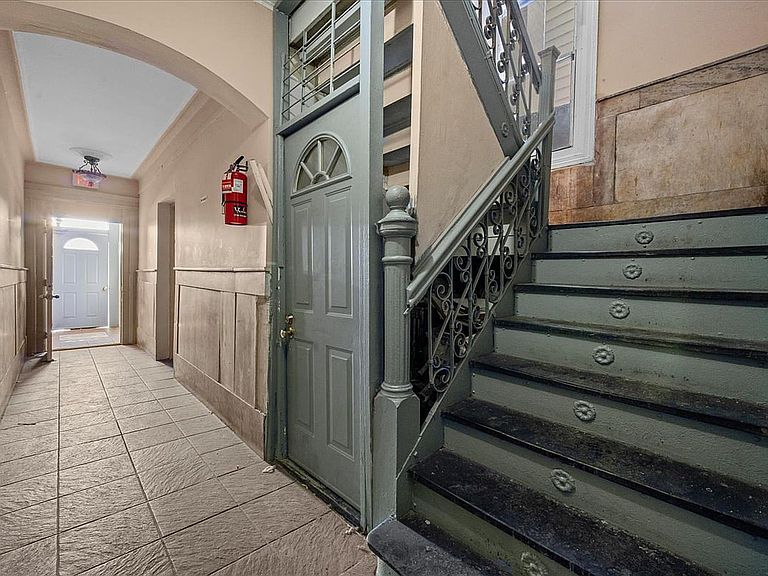
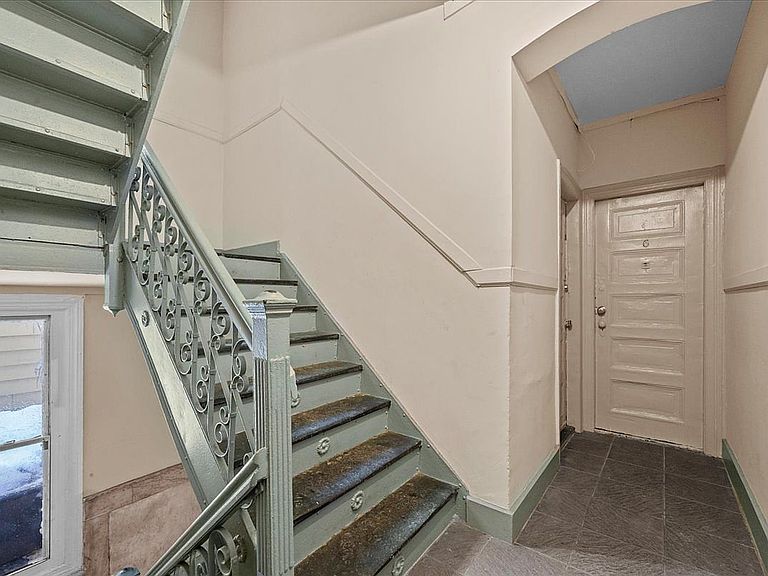
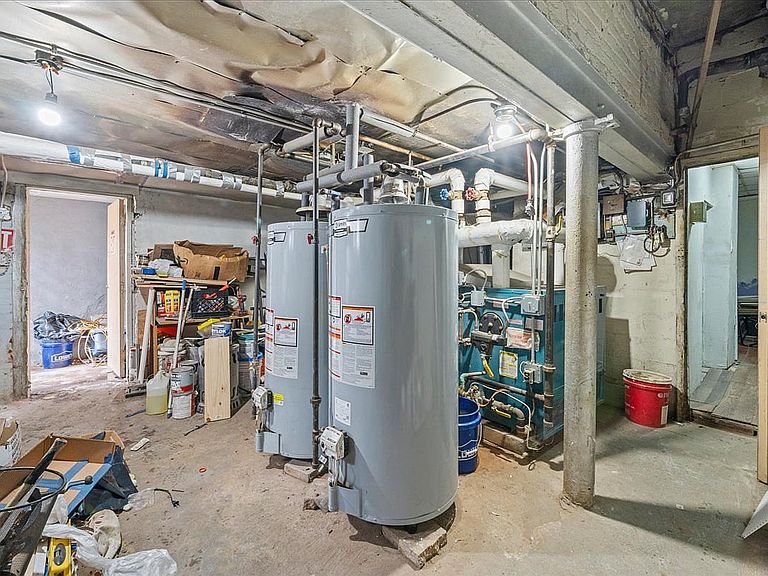
Turnkey multifamily investment - 281 23rd Street is a beautifully-maintained masonry pre-war building spanning approximately 8,492 square feet above-grade. The building hosts 12 apartments, eight of which are configured as 2 BR, while the remaining four are 1 BR. The building is being offered for sale for the first time in almost 40 years. Current ownership has taken long-term care of the property, offering new ownership a turn-key cash flowing asset. Core asset with stable cash flow and future upside - All apartments are rent-stabilized and leased. The asset currently generates over $270,000 gross annually. Average AGI/NSF is $34.61, equating to an average monthly rent of $1837 per apartment, this is approximately 75% of market rents of comparable rentals in area. This allows future investors to take advantage of immediate rental income on day one with virtually no work, while retaining substantial long-term upside as units are brought to market rate over time. Ideal location with multiple amenities - R subway station at the 25th Street station & the Prospect Avenue station (D, N, R, W trains). There are several markets, banks and convenience stores along with dozens of cafes and restaurants in the immediate area along 5th Avenue retail corridor. The location provides straight forward commutes to Manhattan and Brooklyn via these lines. Ideally positioned for quick access to the major highway interchange of I-278 (Gowanus Expressway) and NY-27 (Prospect Expressway).
Getting Around
 Walker's Paradise
 Very Limited Transit
 Very Bikeable
Schools
Construction
Condition
- Year built: 1931
Type & Style
- Home type: MultiFamily
- Property subType: Multi Family
Interior
Bedrooms & Bathrooms
- Bedrooms: 20
- Bathrooms: 16
- Full bathrooms: 8
- 1/2 bathrooms: 8
Interior Area
- Total structure area: 8,493
- Total interior livable area: 8,493 sqft
Property
Details
- Special condition: Resale
Climate Risk is Financial Risk
Every home has a financial story beyond the listing price. Below, you’ll see the climate risks that could affect this property — and in Bills & Affordability, how those risks may influence repairs, insurance, utilities, and long-term value.
Biggest Threats for This Home
- Heat Wave

- Winter Weather

- Tsunami

How This Home’s Risks Compare
FEMA Declared Disasters in Kings County and New York
Understanding the Costs
Financial advisors generally recommend spending no more than 30% of your gross household income on housing costs. In practice, many households stretch to 35% or beyond — especially in high-cost markets.
Estimated Costs Today
| Monthly | Annual | |
|---|---|---|
| Mortgage | $9,349 | $112,188 |
| Home Insurance * | $285 | $3,420 |
| Property Taxes | $862 | $10,344 |
| Electricity | $1,403 | $16,842 |
| Total | $11,899 | $142,788 |
Income You'd Need if You Spent...
New York FAIR Plan Programs



How Costs Could Change Over Time
Climate risk is quickly impacting all of the major home ownership costs. Adjust the growth rates and percentage of income spent on housing below to see how your housing costs could change over the next 10 years — and what income you'd need to keep up.
Comparing Against the Market
Price Per Sq Ft
vs Other Active Listings
Avg $/sqft
vs Homes Sold Last Month
Median $/sqft
Current Market Trends
Median Price Per Square Foot
The median price per square foot of homes sold in this area each month. Compare this to this listing's price per square foot to gauge whether the home is priced in line with recent sales.
Historicals for This Listing
Zestimate History ($/sqft)
Price History
| Date | Event | Price |
|---|---|---|
| 2026-04-23 | Price change | $1,849,000 |
| 2026-04-23 | Price change | $1,849,999 |
| 2026-03-05 | Listed for sale | $1,950,000 |
| 2026-03-05 | Contingent | $1,950,000 |
| 2026-03-04 | Listed for sale | $1,950,000 |
| 2025-06-06 | Listing removed | $2,999,000 |
| 2025-03-10 | Listed for sale | $2,999,000 |
| 2023-12-20 | Listing removed | -- |
| 2023-09-13 | Listed for sale | $2,700,000 |
 View on Zillow