

9206 S Hoover St, Los Angeles, CA, 90044
About This Home
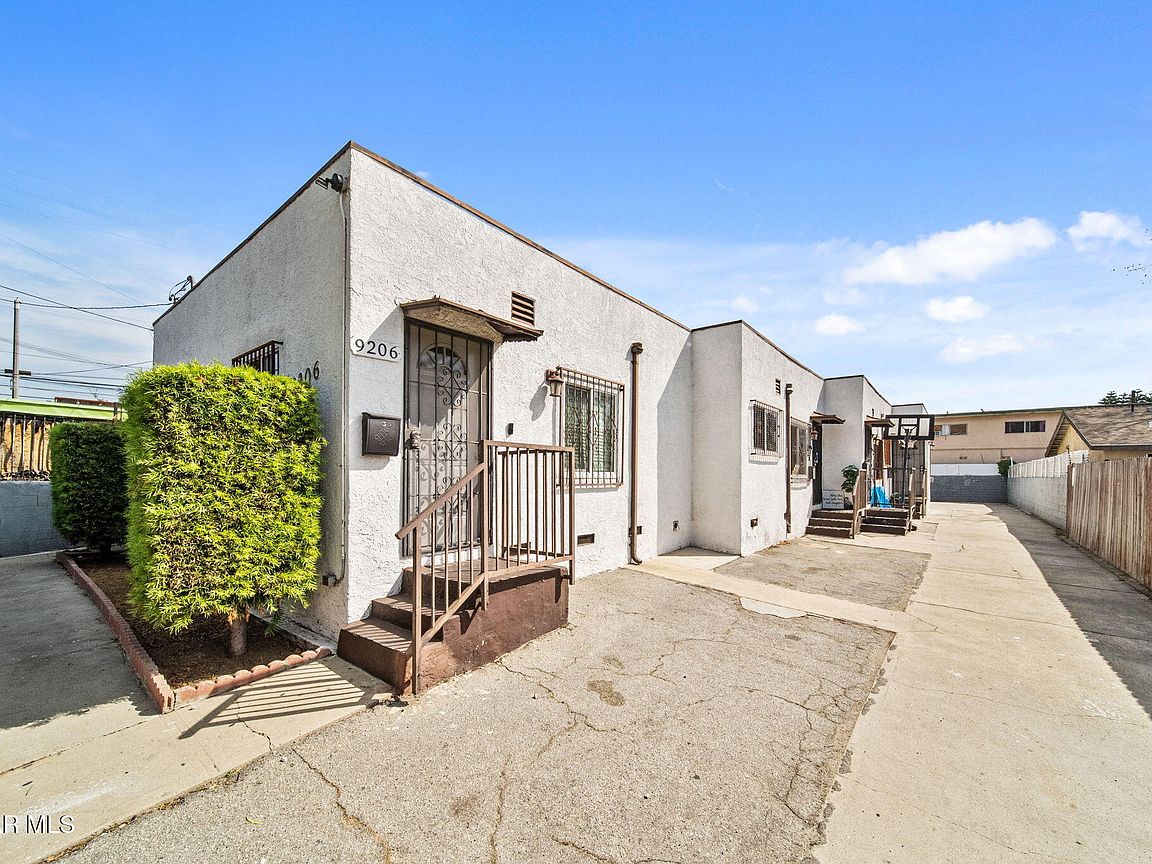
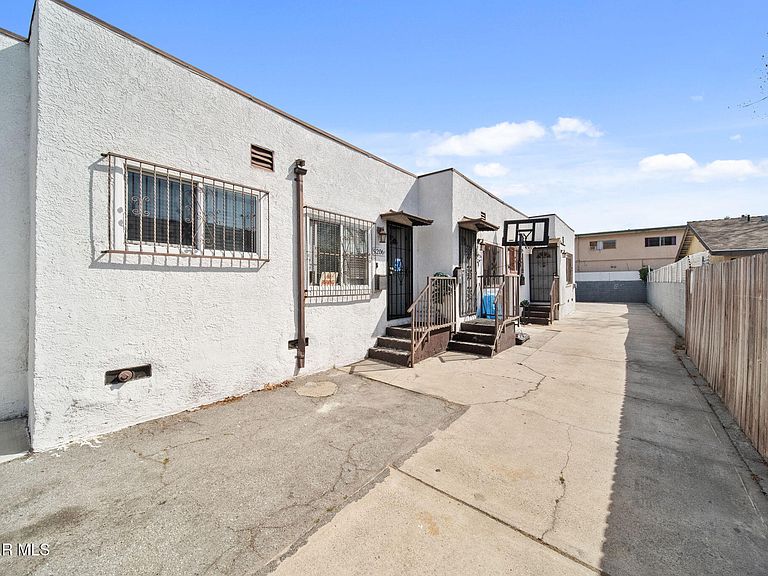
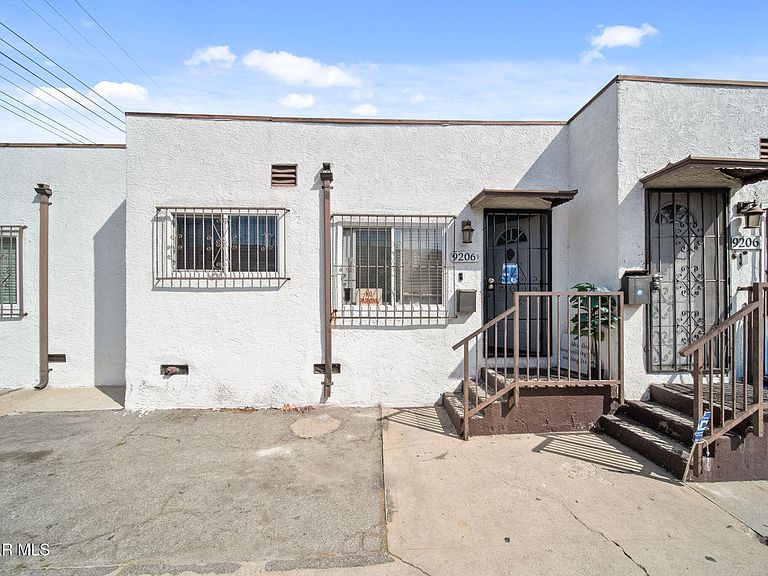
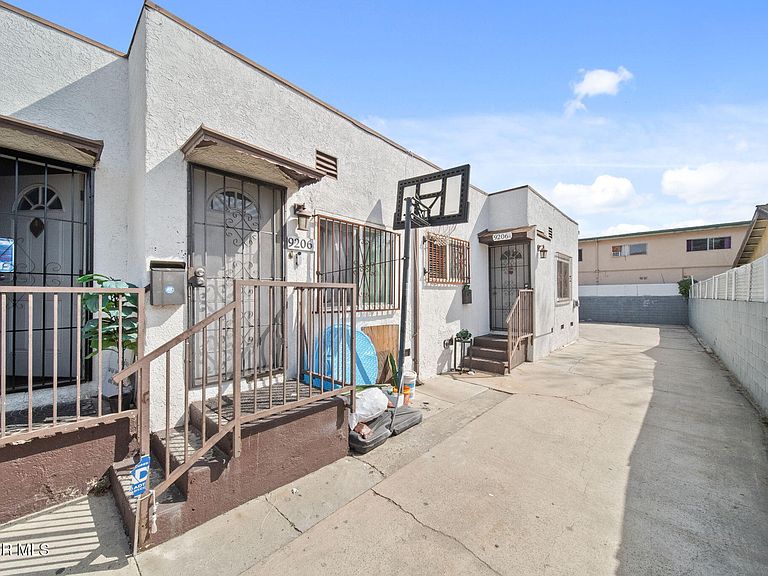
A well-maintained, pride-of-ownership quadruplex nestled in the heart of Los Angeles -- just three miles from SoFi Stadium and centrally positioned between Downtown LA and the beaches. This is a rare opportunity to acquire a fully-occupied, income-producing 4-unit property with a proven rent roll and immediate cash flow from day one. The property features a diversified unit mix of one studio, two one-bedroom/one-bathroom units, and one two-bedroom/one-bathroom unit -- generating $6,595 per month ($79,140 annually) in gross rental income. Each unit is separately metered, keeping utility costs with the tenants and maximizing net operating income for the owner. The building also features three one-car garages and one carport, with tandem parking available in front of each space -- a premium amenity in the South LA rental market that commands tenant loyalty and reduces vacancy. The property has been remodeled and well-maintained, offering investors a true pride-of-ownership asset without deferred maintenance. Units feature open floor plans, washer/dryer hookups, and a welcoming aesthetic that keeps quality tenants in place. The 2-bedroom unit is a standout -- spacious, functional, and among the most in-demand floor plans in this submarket. Strategically located in Vermont Vista, this address sits within reach of major transit corridors, including Harbor Freeway Station (1.9 miles away), and is minutes from Los Angeles International Airport (7.6 miles), local shopping, restaurants, and top-rated schools in the Inglewood Unified School District. Whether your tenants commute to Downtown, the Westside, or the South Bay, this location delivers. For the investor, this property checks every box: stable tenancy, diversified unit mix to spread vacancy risk, no shared utilities, off-street parking, and market rents that present immediate value-add upside -- current rents sit approximately $790/month below the 90044 market ceiling, providing a clear path to increased income through natural turnover and RSO-compliant annual adjustments. This building is priced to move -- comparable 4-unit properties on this very street and throughout 90044 have sold in the $840,000-$965,000 range in 2025 alone.
Getting Around
 Very Walkable
 Good Transit
 Very Bikeable
Schools
Construction
Condition
- Year built: 1948
Materials
- Foundation: Raised
- Roof: Flat
- Construction materials: Stucco
Type & Style
- Home type: MultiFamily
- Property subType: Quadruplex
Interior
Appliances
- Laundry features: In Unit
Bedrooms & Bathrooms
- Bedrooms: 5
- Bathrooms: 4
- Full bathrooms: 4
Features
- Flooring: Laminate
Heating
- Heating features: Central Furnace
Interior Area
- Total structure area: 2,265
- Total interior livable area: 2,265 sqft
Property
Details
- Parcel number: 6039014026
- Special condition: Standard
Features
- Stories: 1
- Entry location: Ground Level w/Steps
- Fencing: Fenced
Lot
- Lot size: 6,098 sqft
Parking
- Total spaces: 3
- Parking features: Garage
- Has garage: Yes
- Attached garage spaces: 3
- Covered spaces: 3
Climate Risk is Financial Risk
Every home has a financial story beyond the listing price. Below, you’ll see the climate risks that could affect this property — and in Bills & Affordability, how those risks may influence repairs, insurance, utilities, and long-term value.
Biggest Threats for This Home
- Earthquake

- Heat Wave

- Inland Flooding

- Wildfire

How This Home’s Risks Compare
FEMA Declared Disasters in Los Angeles County and California
Understanding the Costs
Financial advisors generally recommend spending no more than 30% of your gross household income on housing costs. In practice, many households stretch to 35% or beyond — especially in high-cost markets.
Estimated Costs Today
| Monthly | Annual | |
|---|---|---|
| Mortgage | $4,545 | $54,540 |
| Home Insurance * | $173 | $2,076 |
| Property Taxes | $928 | $11,136 |
| Electricity | $485 | $5,828 |
| Total | $6,131 | $73,572 |
Income You'd Need if You Spent...
California FAIR Plan Programs
How Costs Could Change Over Time
Climate risk is quickly impacting all of the major home ownership costs. Adjust the growth rates and percentage of income spent on housing below to see how your housing costs could change over the next 10 years — and what income you'd need to keep up.
Comparing Against the Market
Price Per Sq Ft
vs Other Active Listings
Avg $/sqft
vs Homes Sold Last Month
Median $/sqft
Current Market Trends
Median Price Per Square Foot
The median price per square foot of homes sold in this area each month. Compare this to this listing's price per square foot to gauge whether the home is priced in line with recent sales.
Historicals for This Listing
Zestimate History ($/sqft)
Price History
| Date | Event | Price |
|---|---|---|
| 2026-04-15 | Listed for sale | $899,000 |
| 2026-01-14 | Listing removed | -- |
| 2026-01-13 | Listed for rent | -- |
| 2021-08-30 | Sold | $860,000 |
| 2021-08-05 | Pending sale | $829,000 |
| 2021-08-02 | Contingent | $829,000 |
| 2021-07-20 | Listed for sale | $829,000 |
| 2021-06-17 | Pending sale | $829,000 |
| 2018-05-01 | Listing removed | $775,000 |
| 2018-01-24 | Price change | $775,000 |
| 2017-07-29 | Price change | $815,000 |
| 2017-07-21 | Listed for sale | $649,000 |
| 2017-06-05 | Pending sale | $649,000 |
| 2017-04-30 | Price change | $649,000 |
| 2017-04-13 | Listed for sale | $759,000 |
| 2011-12-08 | Sold | $204,000 |
| 2003-05-01 | Sold | $243,081 |
| 1994-09-15 | Sold | $175,000 |
 View on Zillow