



423-433 S Van Ness Ave, San Francisco, CA, 94103
About This Home
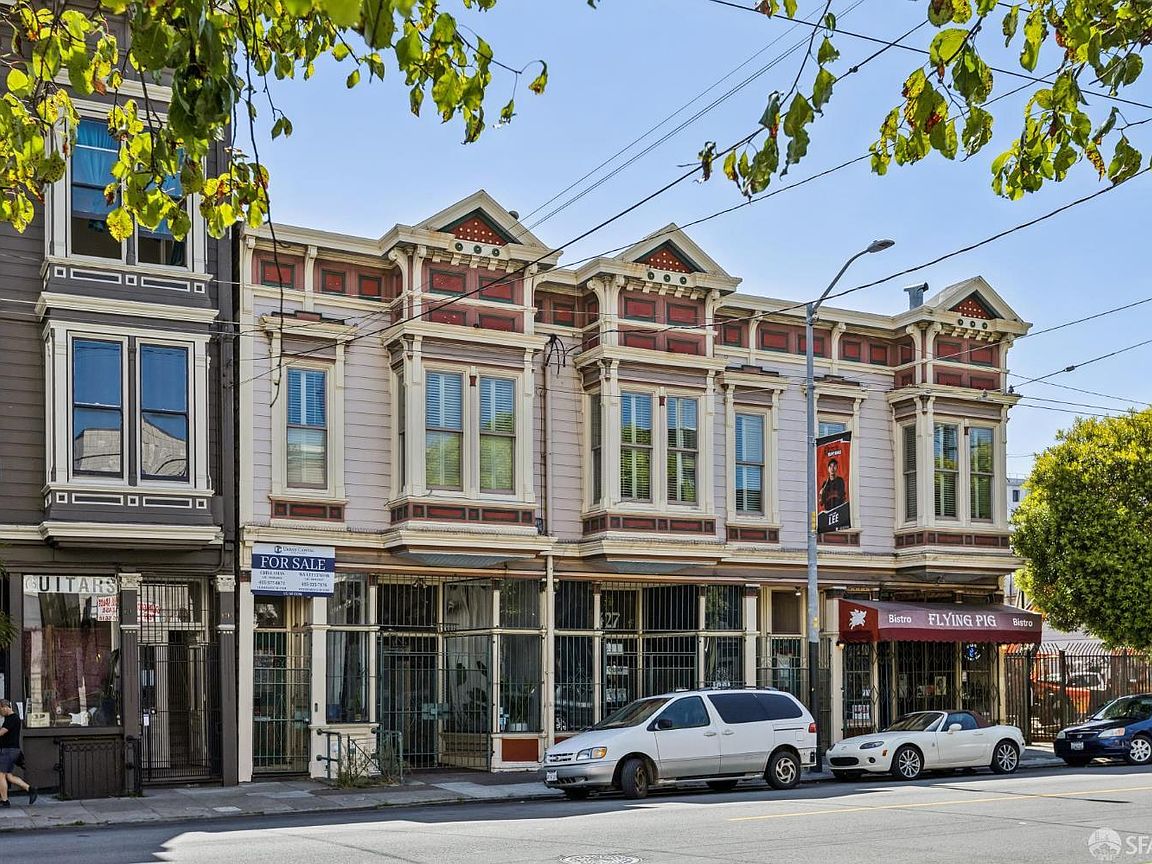
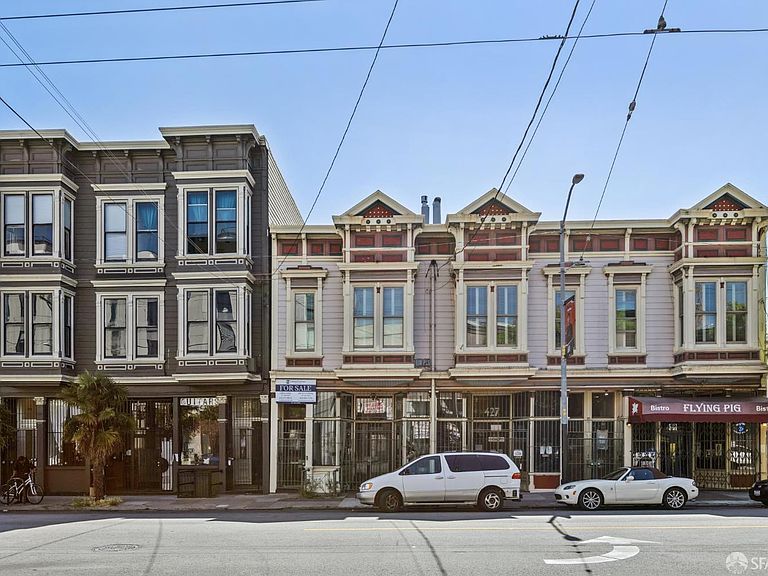
423 South Van Ness Avenue is a six-unit, mixed-use Victorian offered at a 6.02% cap rate. Three exceptionally large three-bedroom residential flats, averaging roughly 1,746 square feet each, sit above three generously sized ground-floor commercial suites averaging about 1,710 square feet, pairing durable, contractually locked commercial income with meaningful residential upside in one of the city's most central, dynamic locations. The property sits at the crossroads of San Francisco, where the Mission, SoMa, and Civic Center submarkets converge along the South Van Ness / Mission / Folsom corridor. Tenants are blocks from 16th Street Mission BART and steps from Highway 101, with Dolores Park, the Valencia retail and dining corridor, Whole Foods, Safeway, and a dense cluster of acclaimed coffee and restaurants all within walking distance. The building also anchors a premier innovation district, surrounded by the offices of leading AI research labs, including OpenAI and Anthropic, plus Salesforce and Google all sustaining the high-wage employment that drives demand across San Francisco.
Getting Around
 Walker's Paradise
 Rider's Paradise
 Biker's Paradise
Schools
Construction
Condition
- Year built: 1900
Type & Style
- Home type: MultiFamily
- Property subType: Mixed Use
Interior
Bedrooms & Bathrooms
- Bedrooms: 9
Interior Area
- Total structure area: 10,568
- Total interior livable area: 10,568 sqft
Property
Details
- Parcel number: 3552023
- Special condition: Offer As Is
Lot
- Lot size: 7,501 sqft
- Features: Shape Regular
Climate Risk is Financial Risk
Every home has a financial story beyond the listing price. Below, you’ll see the climate risks that could affect this property — and in Bills & Affordability, how those risks may influence repairs, insurance, utilities, and long-term value.
Biggest Threats for This Home
- Earthquake

- Inland Flooding

How This Home’s Risks Compare
FEMA Declared Disasters in San Francisco County and California
Understanding the Costs
Financial advisors generally recommend spending no more than 30% of your gross household income on housing costs. In practice, many households stretch to 35% or beyond — especially in high-cost markets.
Estimated Costs Today
| Monthly | Annual | |
|---|---|---|
| Mortgage | $18,835 | $226,020 |
| Home Insurance * | $679 | $8,148 |
| Property Taxes | $4,343 | $52,116 |
| Electricity | $2,266 | $27,194 |
| Total | $26,123 | $313,476 |
Income You'd Need if You Spent...
California FAIR Plan Programs

How Costs Could Change Over Time
Climate risk is quickly impacting all of the major home ownership costs. Adjust the growth rates and percentage of income spent on housing below to see how your housing costs could change over the next 10 years — and what income you'd need to keep up.
Comparing Against the Market
Price Per Sq Ft
vs Other Active Listings
Avg $/sqft
vs Homes Sold Last Month
Median $/sqft
Current Market Trends
Median Price Per Square Foot
The median price per square foot of homes sold in this area each month. Compare this to this listing's price per square foot to gauge whether the home is priced in line with recent sales.
Historicals for This Listing
Zestimate History ($/sqft)
Price History
| Date | Event | Price |
|---|---|---|
| 2026-06-18 | Listed for sale | $3,725,000 |
| 2025-12-31 | Sold | $2,215,000 |
| 2025-12-18 | Pending sale | $2,695,000 |
| 2025-11-07 | Contingent | $2,695,000 |
| 2025-10-15 | Listed for sale | $2,695,000 |
| 2025-07-30 | Listing removed | $2,695,000 |
| 2025-03-18 | Listed for sale | $2,695,000 |
| 2024-09-13 | Listing removed | $2,995,000 |
| 2024-06-10 | Price change | $2,995,000 |
| 2024-03-25 | Price change | $3,250,000 |
| 2024-02-15 | Listed for sale | $3,595,000 |
| 2023-12-27 | Listing removed | -- |
| 2023-11-10 | Price change | $3,595,000 |
| 2023-08-29 | Listed for sale | $3,995,000 |
| 1998-11-25 | Sold | $875,000 |
 View on Zillow