



2119 Tall Grass Road, Fordland, MO, 65652
About This Home
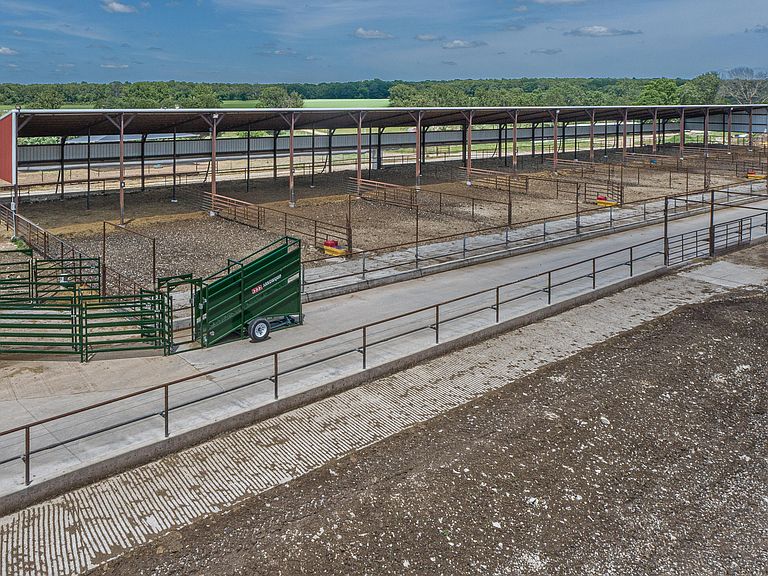
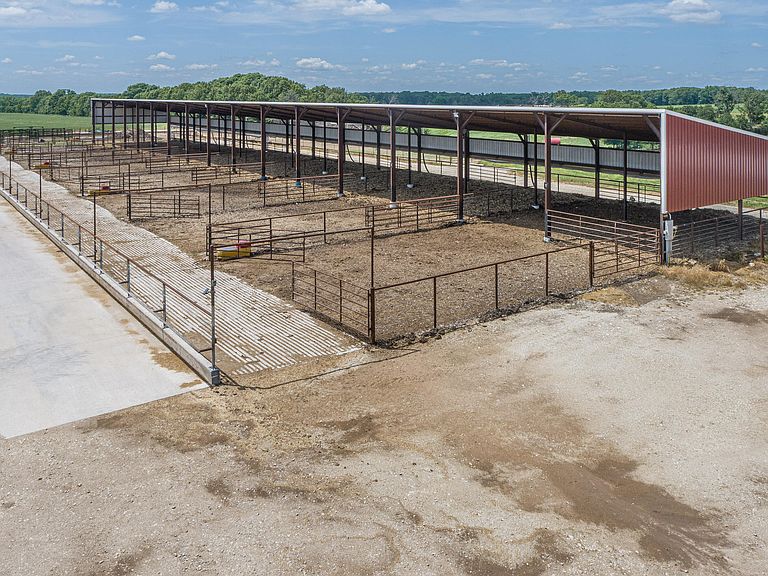
This Highly productive property is located East of Springfield and just minutes north of Hwy 60 and Fordland. This 80+/- acre farm is set up and ready to go for any backgrounding or cattle development operation. Buildings include a 40'x320' feeding barn with 8 40'x100' pens with electric waterers and concrete feed alley. The property has almost 600' of concrete feed bunks with new pipe surrounds that disperse to multiple feeding traps for all aged cattle. The outdoor traps feature 45' x 45' shade that collapse when not in use. The property is offered turn-key with features such as New well house, LP backup generator, and approx. 700 ton of corn silage. The layout of the land is optimized with mostly all tillable land for feed production and the remainder in pasture and cattle space. The complete Arrow Brand working facility with Hydraulic chute and load out are not included but can be purchased separately on a Bill of Sale.
Getting Around
 Car-Dependent
 Very Limited Transit
 Somewhat Bikeable
Schools
Construction
Condition
- Year built: 2000
Type & Style
- Home type: SingleFamily
- Architectural style: None
Interior
Features
- Fireplace features: See Remarks
- Finished area below ground: 0
- Finished area above ground: 0
Heating & Cooling
- Heating features: None
- Cooling features: None
Interior Area
- Total structure area: 0
Property
Details
- Parcel number: 131.212000000004.000
- Other equipment: Generator
Features
- Fencing: Cattle Tight,Barbed Wire,Good,Cross Fenced
- Has view: Yes
- View description: Panoramic
- Topography of land: Gently Rolling,Level
Lot
- Lot size: 80 Acres
Climate Risk is Financial Risk
Every home has a financial story beyond the listing price. Below, you’ll see the climate risks that could affect this property — and in Bills & Affordability, how those risks may influence repairs, insurance, utilities, and long-term value.
Biggest Threats for This Home
- Ice Storm

- Lightning

- Strong Wind

- Cold Wave

- Heat Wave

- Inland Flooding

- Tornado

- Winter Weather

- Hail

- Wildfire

How This Home’s Risks Compare
FEMA Declared Disasters Across Missouri Counties
Understanding the Costs
Financial advisors generally recommend spending no more than 30% of your gross household income on housing costs. In practice, many households stretch to 35% or beyond — especially in high-cost markets.
Estimated Costs Today
| Monthly | Annual | |
|---|---|---|
| Mortgage | $6,042 | $72,504 |
| Home Insurance * | $736 | $8,832 |
| Property Taxes | $487 | $5,844 |
| Electricity | $141 | $1,693 |
| Total | $7,406 | $88,872 |
Income You'd Need if You Spent...
Missouri FAIR Plan Programs
How Costs Could Change Over Time
Climate risk is quickly impacting all of the major home ownership costs. Adjust the growth rates and percentage of income spent on housing below to see how your housing costs could change over the next 10 years — and what income you'd need to keep up.
Comparing Against the Market
Price Per Sq Ft
vs Other Active Listings
Avg $/sqft
vs Homes Sold Last Month
Median $/sqft
Current Market Trends
Median Price Per Square Foot
The median price per square foot of homes sold in this area each month. Compare this to this listing's price per square foot to gauge whether the home is priced in line with recent sales.
Historicals for This Listing
Zestimate History ($/sqft)
Price History
| Date | Event | Price |
|---|---|---|
| 2026-08-13 | Price change | $1,049,000 |
| 2026-07-15 | Price change | $1,195,000 |
| 2026-06-17 | Price change | $1,280,000 |
| 2026-05-28 | Price change | $1,400,000 |
| 2022-09-08 | Pending sale | $895,000 |
 View on Zillow