
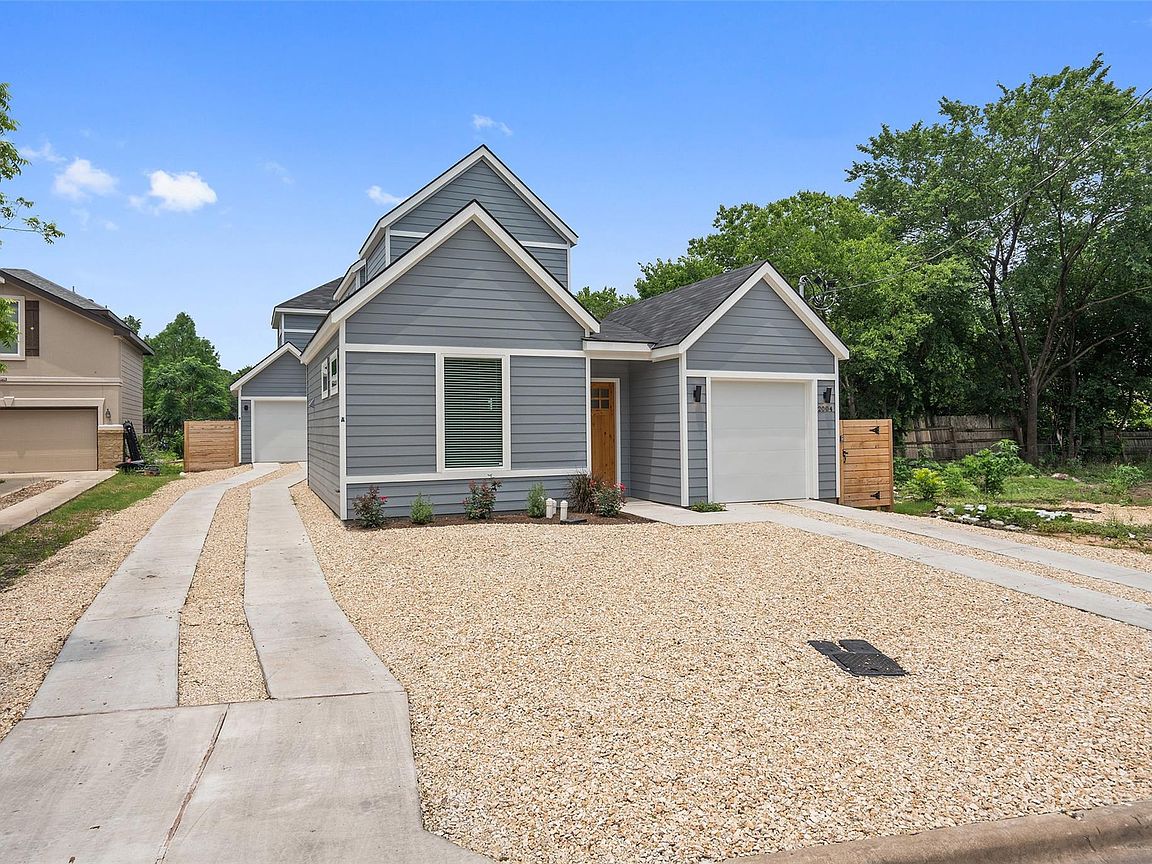
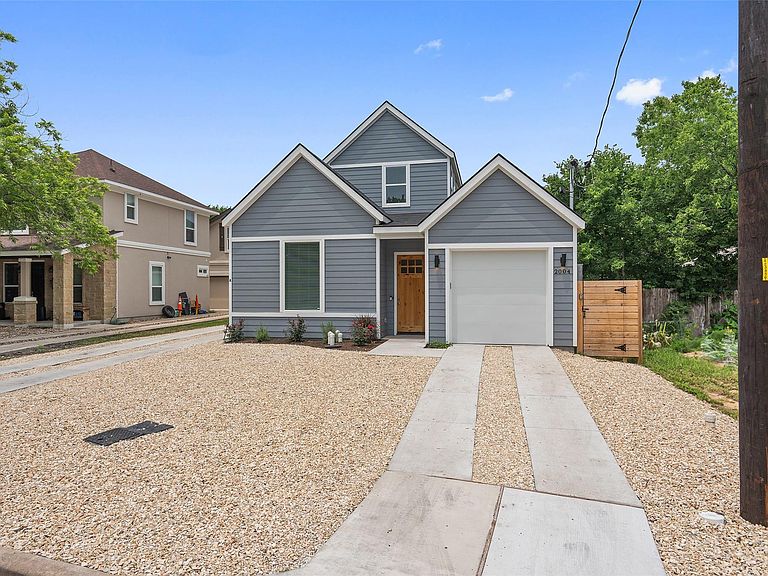
2004 Maxwell Ln, Austin, TX, 78741
About This Home
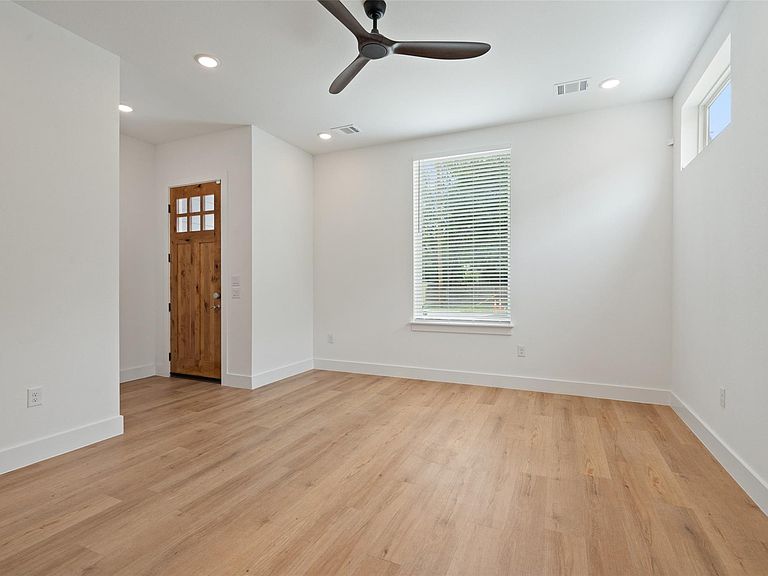
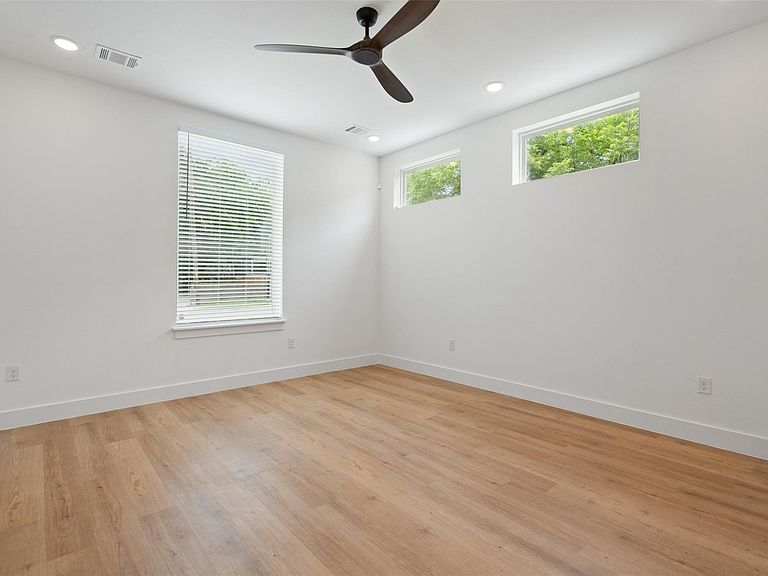
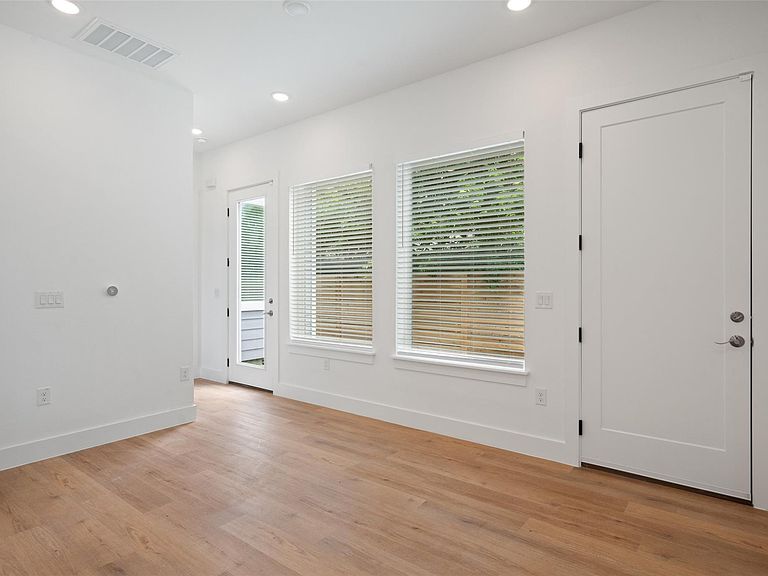
Recently built - 2 units DETACHED, allowing for multiple exit strategies in the future (condo and sell separately). Long term tenants with room to increase rents. Nearne development at Pleasant valley and Riverside make this a very attractive area for young professional tenants or owner occupants who want an income property to offset housing expenses. An exceptional investment opportunity in the heart of East Austin's rapidly growing corridor, 2004 Maxwell Lane is being offered as a fully income-producing duplex featuring detached Unit A and Unit B residences, providing privacy and flexibility rarely found in today's market. Unit A is currently leased for $2,850 per month and Unit B generates $2,300 per month, creating immediate cash flow with a combined rental income of $5,150 monthly. The property consists of two separate homes thoughtfully positioned on the lot, each offering modern finishes, functional floorplans, private outdoor space, and independent living environments ideal for long-term tenants or owner-occupants seeking supplemental income. Located in the vibrant Montopolis area, residents enjoy unbeatable access to Downtown Austin, Austin-Bergstrom International Airport, Tesla Gigafactory, Oracle Campus, and major commuter routes including Highways 71, 183, and I-35. Outdoor enthusiasts will appreciate nearby Roy G. Guerrero Colorado River Park and the hike and bike trails along Lady Bird Lake, while local dining, coffee shops, shopping, and entertainment are just minutes away. The property also benefits from the ongoing Pleasant Valley/Riverside development, including a new music venue scheduled to open in early 2027, further enhancing the area's long-term growth and appeal, making this a premier turnkey investment in one of Austin's most dynamic and appreciating neighborhoods.
Getting Around
 Somewhat Walkable
 Some Transit
 Somewhat Bikeable
Schools
Construction
Condition
- Property condition: Resale
- Year built: 2023
Materials
- Foundation: Permanent,Slab
- Roof: Metal
Type & Style
- Home type: MultiFamily
- Property subType: Duplex
Interior
Appliances
- Appliances included: Gas Range,Gas Water Heater
Bedrooms & Bathrooms
- Bedrooms: 5
- Bathrooms: 6
Features
- None
- Window features: None
- Flooring: Wood
Heating & Cooling
- Heating features: Space Heater
- Cooling features: Wall/Window Unit(s)
Interior Area
- Total interior livable area: 2,617 sqft
Property
Accessibility
- Accessibility features: None
Details
- Parcel number: 03111601030000
- Special condition: Standard
Features
- Levels: One
- Stories: 1
- Pool features: None
- Patio & porch: Porch
- Exterior features: None
- Fencing: Wood
- Has view: Yes
- View description: None
- Waterfront features: None
Lot
- Lot size: 6,538 sqft
- Features: Back Yard,Front Yard,Level,Trees-Medium (20 Ft - 40 Ft)
Parking
- Total spaces: 2
- Parking features: Attached,Driveway,Garage
- Has garage: Yes
- Attached garage spaces: 2
- Covered spaces: 2
Climate Risk is Financial Risk
Every home has a financial story beyond the listing price. Below, you’ll see the climate risks that could affect this property — and in Bills & Affordability, how those risks may influence repairs, insurance, utilities, and long-term value.
Biggest Threats for This Home
- Tornado

- Hail

- Heat Wave

How This Home’s Risks Compare
FEMA Declared Disasters Across Texas Counties
Understanding the Costs
Financial advisors generally recommend spending no more than 30% of your gross household income on housing costs. In practice, many households stretch to 35% or beyond — especially in high-cost markets.
Estimated Costs Today
| Monthly | Annual | |
|---|---|---|
| Mortgage | $4,298 | $51,576 |
| Home Insurance * | $359 | $4,308 |
| Property Taxes | $927 | $11,124 |
| Electricity | $287 | $3,448 |
| Total | $5,871 | $70,452 |
Income You'd Need if You Spent...
Texas FAIR Plan Programs


How Costs Could Change Over Time
Climate risk is quickly impacting all of the major home ownership costs. Adjust the growth rates and percentage of income spent on housing below to see how your housing costs could change over the next 10 years — and what income you'd need to keep up.
Comparing Against the Market
Price Per Sq Ft
vs Other Active Listings
Avg $/sqft
vs Homes Sold Last Month
Median $/sqft
Current Market Trends
Median Price Per Square Foot
The median price per square foot of homes sold in this area each month. Compare this to this listing's price per square foot to gauge whether the home is priced in line with recent sales.
Historicals for This Listing
Zestimate History ($/sqft)
Price History
| Date | Event | Price |
|---|---|---|
| 2026-07-23 | Listed for sale | $850,000 |
| 2022-02-18 | Sold | -- |
| 2022-02-09 | Pending sale | $384,900 |
| 2022-01-31 | Contingent | $384,900 |
| 2022-01-26 | Listed for sale | $384,900 |
| 2022-01-21 | Contingent | $384,900 |
| 2021-12-20 | Listed for sale | $384,900 |
| 2021-12-07 | Pending sale | $384,900 |
| 2021-12-06 | Contingent | $384,900 |
| 2021-12-01 | Price change | $384,900 |
| 2021-10-17 | Price change | $389,999 |
| 2021-09-16 | Listed for sale | $410,000 |
| 2021-06-17 | Listing removed | -- |
| 2021-06-17 | Listed for sale | $360,000 |
| 2021-05-01 | Pending sale | $360,000 |
| 2021-04-23 | Price change | $360,000 |
| 2021-03-13 | Listed for sale | $370,000 |
 View on Zillow