


423 Shetlands Ln, Glen Burnie, MD, 21061
About This Home
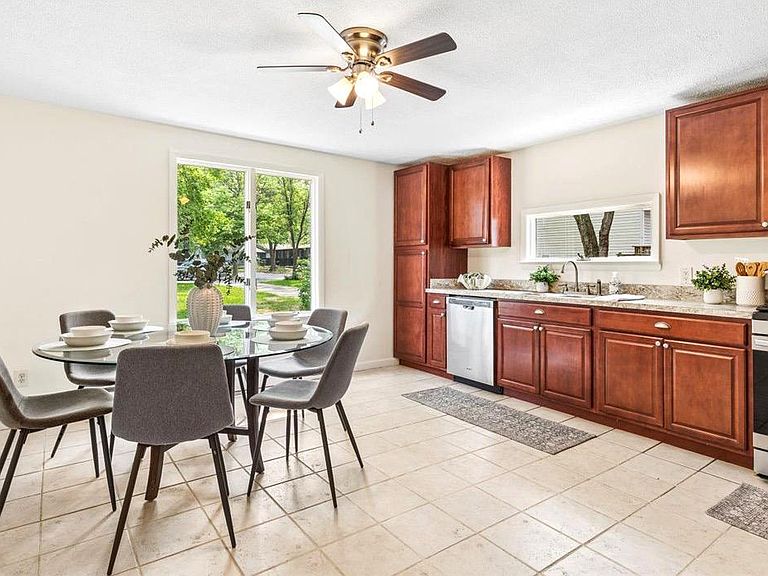
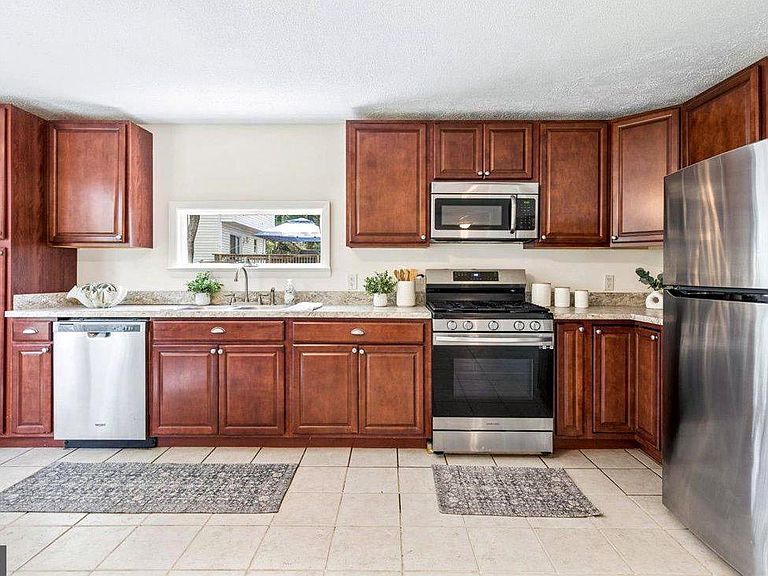
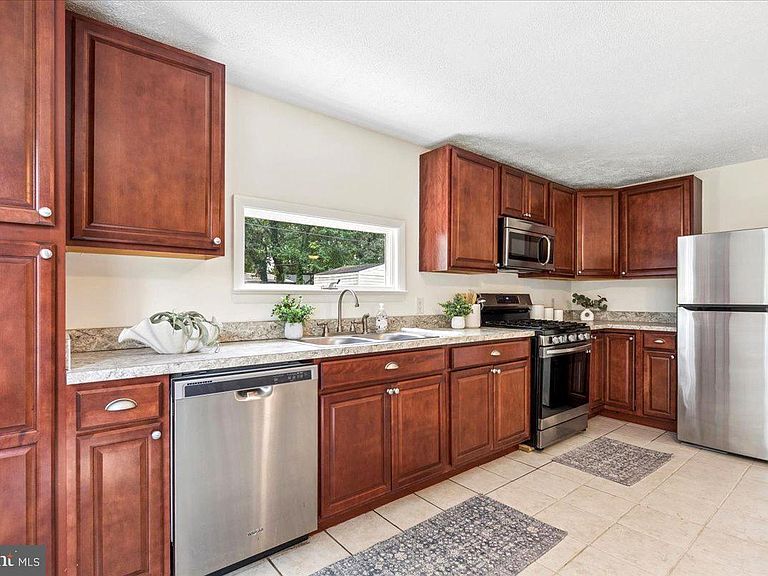
Enjoy the luxury of a spacious home with the financial advantage of built-in rental income! Rarely does a property offer this much space, flexibility, and immediate income potential. The spacious 2,700-square-foot main residence features 4 bedrooms and 2 full baths with numerous recent updates, including fresh paint, brand-new carpet, a new roof (2021), and new siding (2023). The expansive layout provides plenty of room for everyday living, entertaining, and growing needs. Adding tremendous value is the separate 2nd floor 2-bedroom, 1-bath apartment offering approximately 1,100 square feet of living space. With its own private exterior entrance, dedicated driveway and walkway, and separately metered electric service, it provides excellent privacy for both owner and tenant. The apartment is currently rented for $1,675 per month (Tenant will vacate August 31st), creating immediate income that can help offset your monthly mortgage. Unit is currently licensed as a rental, so the new owners can have piece of mind regarding zoning. Whether you're looking to lower your monthly housing costs, accommodate extended family while maintaining privacy, or own a property with built-in investment potential, this unique offering delivers a level of flexibility that's difficult to find. Opportunities like this are rare—don't miss your chance to own a spacious home with the added benefit of established rental income.
Getting Around
 Car-Dependent
 Minimal Transit
 Somewhat Bikeable
Schools
Construction
Condition
- Year built: 1958
Materials
- Foundation: Block
- Roof: Shingle
- Construction materials: Frame
Type & Style
- Home type: SingleFamily
- Property subType: Single Family Residence
Interior
Appliances
- Appliances included: Electric Water Heater
- Laundry features: Common Area,Shared
Basement
- Area: 0
Bedrooms & Bathrooms
- Bedrooms: 6
- Bathrooms: 3
- Full bathrooms: 3
- Main level bathrooms: 1
- Main level bedrooms: 1
Features
- 2nd Kitchen,Combination Kitchen/Dining,Dining Area,Entry Level Bedroom,Family Room Off Kitchen,Formal/Separate Dining Room,Eat-in Kitchen,Kitchen - Galley,Dry Wall,Wood Walls
- Window features: Double Pane Windows
- Flooring: Carpet,Ceramic Tile,Laminate
- Finished area below ground: 0
- Finished area above ground: 3,600
Heating & Cooling
- Heating features: Central,Electric
- Cooling features: Central Air,Ceiling Fan(s),Electric
Interior Area
- Total structure area: 3,600
- Total interior livable area: 3,600 sqft
Property
Accessibility
- Accessibility features: None
Details
- Parcel number: 020300013754800
- Zoning: R15
- Special condition: Standard
Features
- Levels: Multi/Split,Four
- Stories: 4
- Pool features: None
Lot
- Lot size: 0.36 Acres
- Features: Corner Lot
Parking
- Parking features: Driveway
- Has uncovered spaces: Yes
Climate Risk is Financial Risk
Every home has a financial story beyond the listing price. Below, you’ll see the climate risks that could affect this property — and in Bills & Affordability, how those risks may influence repairs, insurance, utilities, and long-term value.
Biggest Threats for This Home
- Lightning

- Winter Weather

- Tsunami

How This Home’s Risks Compare
FEMA Declared Disasters Across Maryland Counties
Understanding the Costs
Financial advisors generally recommend spending no more than 30% of your gross household income on housing costs. In practice, many households stretch to 35% or beyond — especially in high-cost markets.
Estimated Costs Today
| Monthly | Annual | |
|---|---|---|
| Mortgage | $2,780 | $33,360 |
| Home Insurance * | $176 | $2,112 |
| Property Taxes | $602 | $7,224 |
| Electricity | $458 | $5,504 |
| Total | $4,016 | $48,192 |
Income You'd Need if You Spent...
Maryland FAIR Plan Programs



How Costs Could Change Over Time
Climate risk is quickly impacting all of the major home ownership costs. Adjust the growth rates and percentage of income spent on housing below to see how your housing costs could change over the next 10 years — and what income you'd need to keep up.
Comparing Against the Market
Price Per Sq Ft
vs Other Active Listings
Avg $/sqft
vs Homes Sold Last Month
Median $/sqft
Current Market Trends
Median Price Per Square Foot
The median price per square foot of homes sold in this area each month. Compare this to this listing's price per square foot to gauge whether the home is priced in line with recent sales.
Historicals for This Listing
Zestimate History ($/sqft)
Price History
| Date | Event | Price |
|---|---|---|
| 2026-08-09 | Price change | $539,900 |
| 2026-07-17 | Listed for sale | $549,900 |
| 2023-08-26 | Listing removed | -- |
| 2023-08-19 | Listed for rent | $2,500 |
| 2016-04-22 | Sold | $260,000 |
| 2016-03-09 | Price change | $289,000 |
| 2016-02-19 | Price change | $299,900 |
| 2015-06-18 | Price change | $349,900 |
| 2015-05-07 | Price change | $389,000 |
| 2015-03-15 | Listed for sale | $399,000 |
| 2015-01-09 | Sold | $255,000 |
| 2003-12-23 | Sold | $260,000 |
| 2003-07-29 | Sold | $260,000 |
| 1998-08-04 | Sold | $160,000 |
 View on Zillow