


920 N 1st St, Alhambra, CA, 91801
About This Home
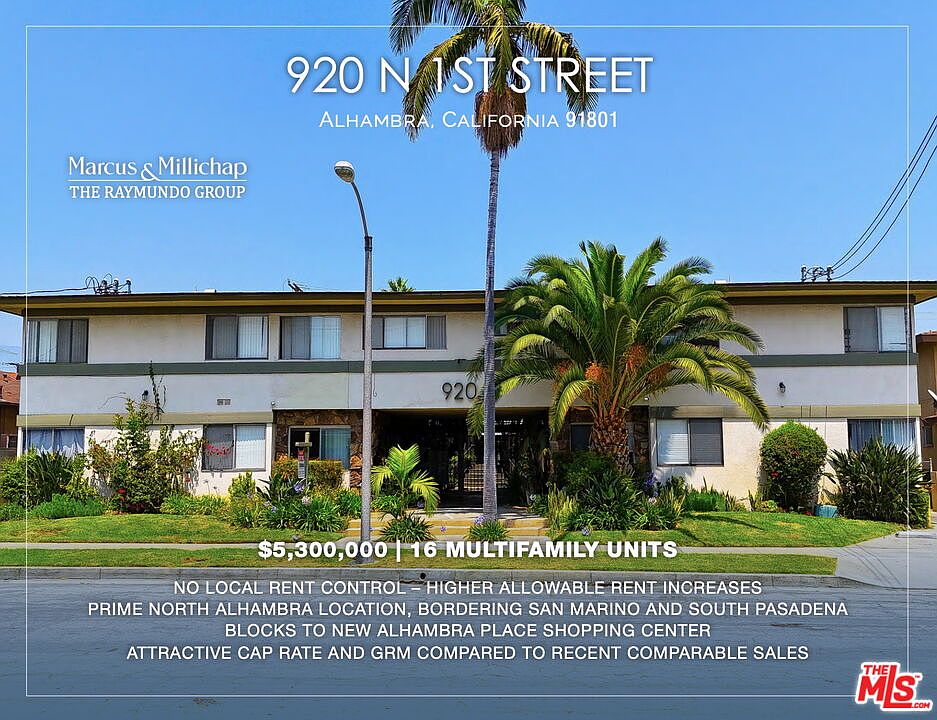
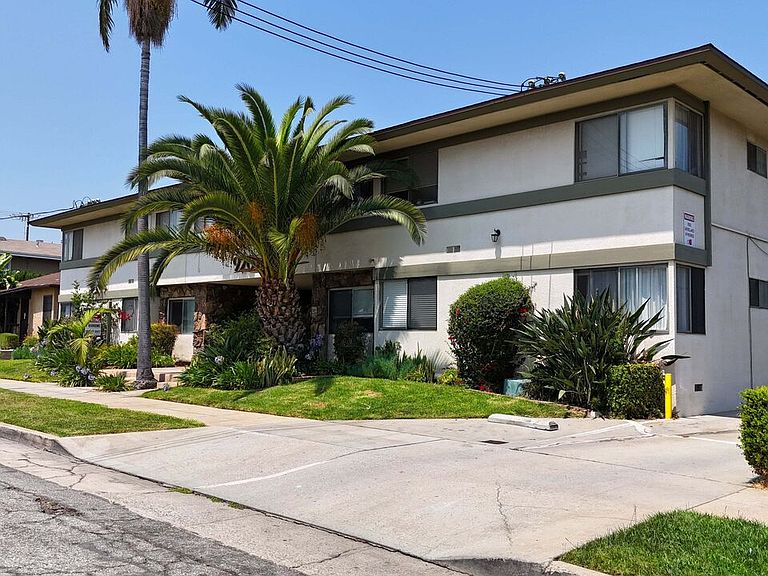
Situated just two blocks south of the affluent cities of San Marino and South Pasadena, the property benefits from its location in one of the most attractive rental submarkets of the West San Gabriel Valley. Because the property is not subject to local rent control, an investor can increase rents by a greater amount each year, when compared with multifamily investments in Los Angeles and other local cities. With current rents approximately 21% below those of similar neighboring properties, a new owner may be able to add significant value while improving the building's cash flow substantially. Constructed in 1959, the two-story structure surrounds a well-landscaped, quiet courtyard atop a 14,706-square foot lot. The property has been meticulously maintained throughout its ownership, while select units have been renovated with new hardwood floors, new kitchen cabinets, and new ceiling fans. The gated complex includes eight security cameras, several of which are trained on the 16 covered parking spaces. The landlord-owned laundry facilities add an additional revenue stream. The separate gas and electricity meters, pitched roofs, and partial copper plumbing should help to reduce future expenses. Located near the corner of Huntington Drive and Los Robles Avenue, the building sits just across the border from both San Marino and South Pasadena. Being within walking distance of Ralph's, In-N-Out Burger, and the new $130 million Alhambra Place Shopping Center helps to attract tenants. Median home values have increased by 40% since 2020, resulting in increased demand for rental units as residents are priced out of homeownership now that the median single-family home is valued above $1,000,000. Apartment demand in the area is also elevated due to the fact that Alhambra has only added 540 units over the past 30 years. This amount of new development is up to 10 times slower than other communities in the area, and the resulting demand for existing apartments is projected to exert sustained upwards pressure on local rents, benefitting apartment landlords. The property also sits just two miles from the 110 Freeway and two-and-a-half miles from the10 Freeway, affording tenants convenient access to Downtown Los Angeles, Pasadena, and the rest of the San Gabriel Valley.
Getting Around
 Very Walkable
 Very Limited Transit
 Bikeable
Schools
Construction
Condition
- Year built: 1959
Type & Style
- Home type: MultiFamily
- Property subType: Multi Family
Interior
Bedrooms & Bathrooms
- Bedrooms: 22
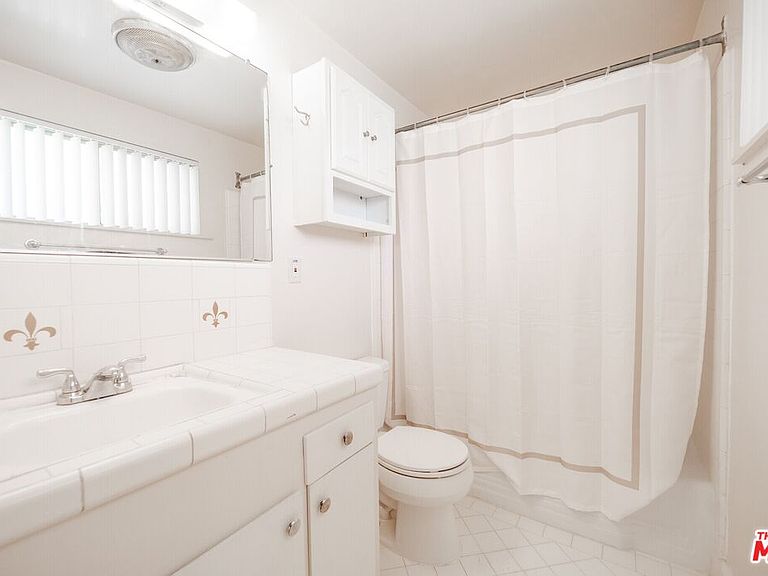
- Bathrooms: 16
Heating & Cooling
- Heating features: Other
- Cooling features: Other
Interior Area
- Total structure area: 10,911
- Total interior livable area: 10,911 sqft
Property
Details
- Parcel number: 5321020021
- Zoning: ALRPD*
- Special condition: Standard
- Other equipment: Other
Features
- Levels: Two
- Stories: 2
Lot
- Lot size: 0.34 Acres
Parking
- Total spaces: 16
- Parking features: Assigned
Climate Risk is Financial Risk
Every home has a financial story beyond the listing price. Below, you’ll see the climate risks that could affect this property — and in Bills & Affordability, how those risks may influence repairs, insurance, utilities, and long-term value.
Biggest Threats for This Home
- Earthquake

- Heat Wave

- Inland Flooding

- Wildfire

How This Home’s Risks Compare
FEMA Declared Disasters in Los Angeles County and California
Understanding the Costs
Financial advisors generally recommend spending no more than 30% of your gross household income on housing costs. In practice, many households stretch to 35% or beyond — especially in high-cost markets.
Estimated Costs Today
| Monthly | Annual | |
|---|---|---|
| Mortgage | $25,581 | $306,972 |
| Home Insurance * | $556 | $6,672 |
| Property Taxes | $2,824 | $33,888 |
| Electricity | $2,339 | $28,076 |
| Total | $31,300 | $375,600 |
Income You'd Need if You Spent...
California FAIR Plan Programs
How Costs Could Change Over Time
Climate risk is quickly impacting all of the major home ownership costs. Adjust the growth rates and percentage of income spent on housing below to see how your housing costs could change over the next 10 years — and what income you'd need to keep up.
Comparing Against the Market
Price Per Sq Ft
vs Other Active Listings
Avg $/sqft
vs Homes Sold Last Month
Median $/sqft
Current Market Trends
Median Price Per Square Foot
The median price per square foot of homes sold in this area each month. Compare this to this listing's price per square foot to gauge whether the home is priced in line with recent sales.
Historicals for This Listing
Zestimate History ($/sqft)
No zestimate history available
Price History
| Date | Event | Price |
|---|---|---|
| 2026-01-12 | Price change | $5,059,000 |
| 2025-07-21 | Listed for sale | $5,300,000 |
 View on Zillow