


100 N Kenmore Ave, Los Angeles, CA, 90004
About This Home
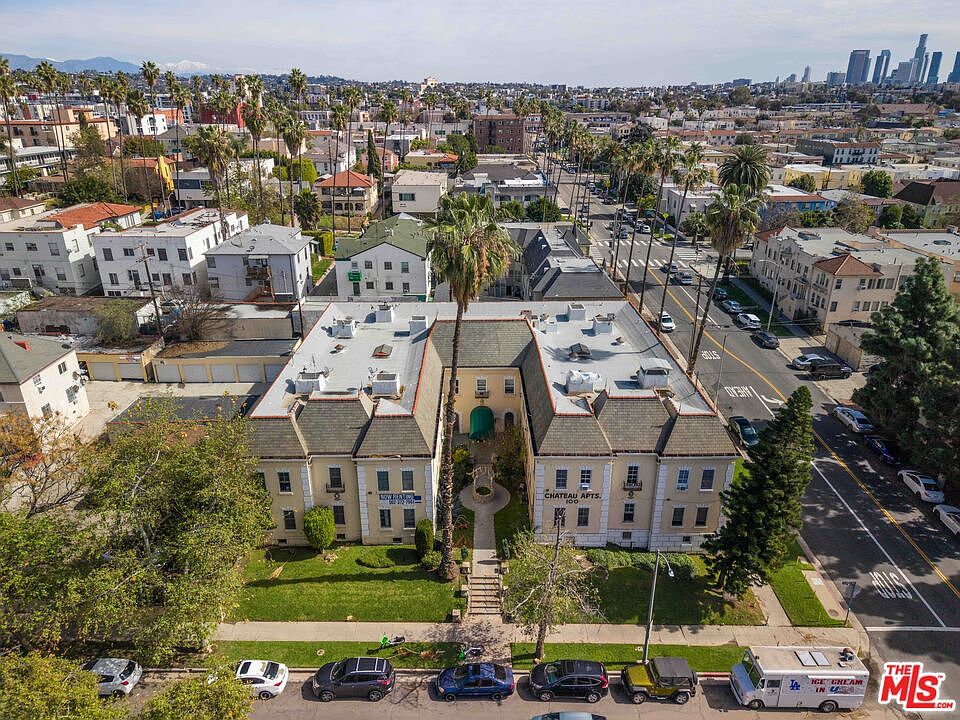
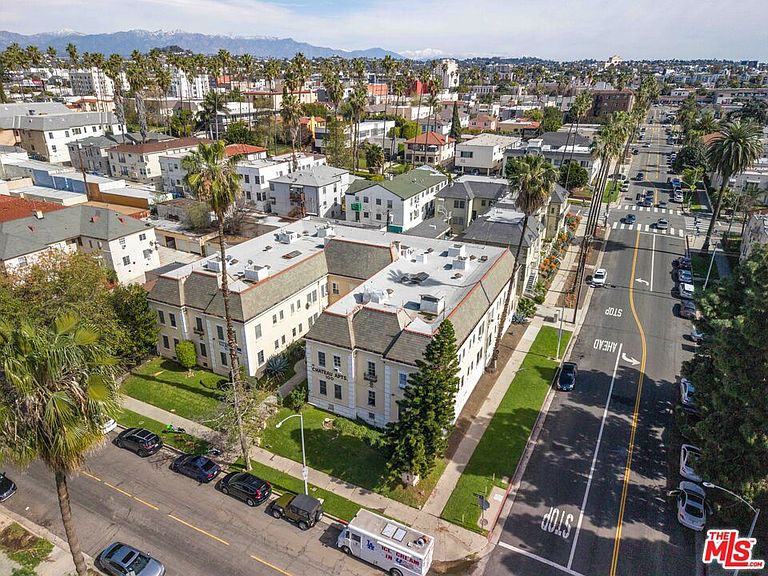
***MAY BE PURCHASED INDIVIDUALLY OR IN COMBINATION WITH ANY OR ALL OF 3333 4TH ST, 601 N ROSSMORE, 1311 INGRAHAM & 508 S HOBART*** 100 & 112 N Kenmore Ave is a 34-unit apartment building constructed in 1923, plus an additional adjacent parcel, located in the highly desirable Hancock Park / Koreatown area of Los Angeles. The property reflects classic early 20th-century architecture and offers a well-scaled residential footprint within a strong neighborhood setting. The units average approximately 540 square feet and are primarily studios designed to serve the area's deep renter pool. The building is complemented by detached garages and a separate parcel currently utilized for parking (112 N Kenmore Ave), providing functional on-site parking in a submarket where it is increasingly valuable. The property is situated in a highly attractive residential pocket known for its tree-lined streets, proximity to Hancock Park, and immediate access to the amenities of Koreatown and Larchmont Village. The neighborhood offers a balanced mix of established residential character and urban convenience. Residents benefit from excellent connectivity, with nearby Metro rail stations and major thoroughfares providing efficient access to Downtown Los Angeles, Hollywood, Mid-Wilshire, and surrounding employment centers. The area is also supported by a wide range of dining, retail, and cultural destinations, along with nearby open space including Robert L. Burns Park and larger regional parks within a short drive. From an investment perspective, 100 & 112 N Kenmore Ave presents meaningful rental upside potential through strategic unit improvements and operational enhancements. The separate parking parcel creates additional optionality, including the ability to optimize parking revenue or explore future redevelopment opportunities consistent with zoning and market demand. With its central location, strong residential setting, and clear pathways for value creation, the property offers both stable in-place income and long-term development potential in one of Los Angeles' most supply-constrained rental markets.
Getting Around
 Walker's Paradise
 Excellent Transit
 Bikeable
Schools
Construction
Condition
- Year built: 1923
Type & Style
- Home type: MultiFamily
- Property subType: Multi Family
Interior
Bedrooms & Bathrooms
- Bathrooms: 34
Heating & Cooling
- Heating features: Other
- Cooling features: Other
Interior Area
- Total structure area: 18,576
- Total interior livable area: 18,576 sqft
Property
Details
- Parcel number: 5518019009
- Zoning: LAR3
- Special condition: Standard
- Other equipment: Other
Features
- Levels: Multi/Split
Lot
- Lot size: 0.35 Acres
Parking
- Total spaces: 12
- Parking features: Detached
- Has garage: Yes
Climate Risk is Financial Risk
Every home has a financial story beyond the listing price. Below, you’ll see the climate risks that could affect this property — and in Bills & Affordability, how those risks may influence repairs, insurance, utilities, and long-term value.
Biggest Threats for This Home
- Earthquake

- Heat Wave

- Wildfire

How This Home’s Risks Compare
FEMA Declared Disasters in Los Angeles County and California
Understanding the Costs
Financial advisors generally recommend spending no more than 30% of your gross household income on housing costs. In practice, many households stretch to 35% or beyond — especially in high-cost markets.
Estimated Costs Today
| Monthly | Annual | |
|---|---|---|
| Mortgage | $22,754 | $273,048 |
| Home Insurance * | $1,062 | $12,744 |
| Property Taxes | $2,512 | $30,144 |
| Electricity | $3,983 | $47,800 |
| Total | $30,311 | $363,732 |
Income You'd Need if You Spent...
California FAIR Plan Programs
How Costs Could Change Over Time
Climate risk is quickly impacting all of the major home ownership costs. Adjust the growth rates and percentage of income spent on housing below to see how your housing costs could change over the next 10 years — and what income you'd need to keep up.
Comparing Against the Market
Price Per Sq Ft
vs Other Active Listings
Avg $/sqft
vs Homes Sold Last Month
Median $/sqft
Current Market Trends
Median Price Per Square Foot
The median price per square foot of homes sold in this area each month. Compare this to this listing's price per square foot to gauge whether the home is priced in line with recent sales.
Historicals for This Listing
Zestimate History ($/sqft)
Price History
| Date | Event | Price |
|---|---|---|
| 2026-06-22 | Listed for sale | $4,500,000 |
 View on Zillow