



2116 Chapman St, San Angelo, TX, 76901
About This Home
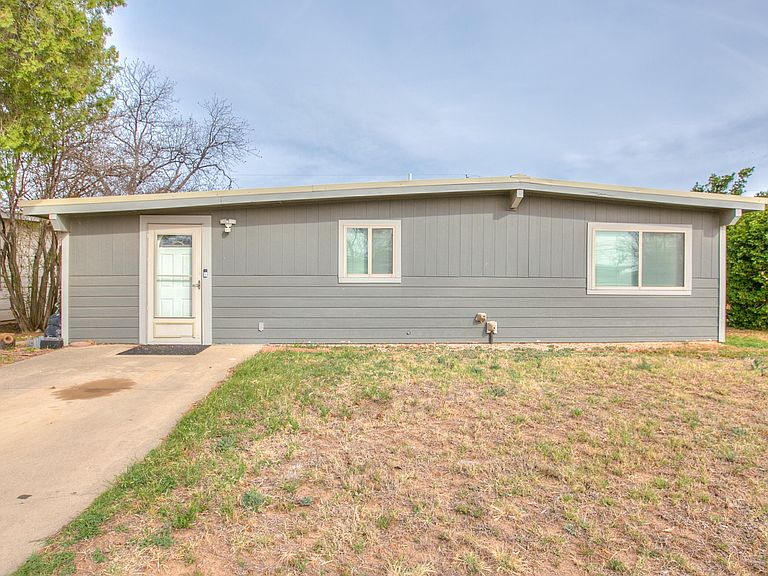
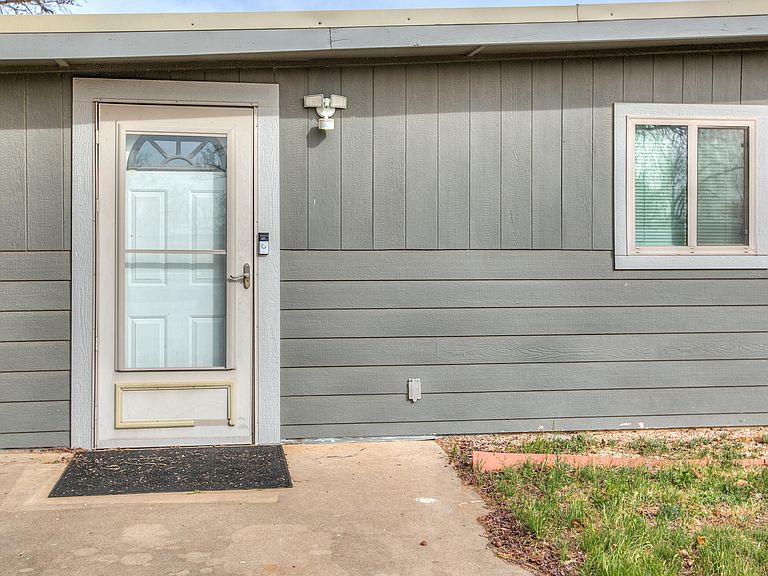
4 Bedroom, 2 Bathroom, 1894 sq. ft. The HVAC system was completely replaced in 2018 The hot water heater was replaced in 2018 The exterior siding was replaced in 2018 All Windows were replaced with double pane windows in 2018 The metal roof was replaced in 2020 The breaker panel was replaced and brought up to code in 2023 Both bathrooms were completely remodeled with new fixtures (including new shower), counters,appliances, and tile floors in 2023 New gas stove and oven/air fryer installed in 2023 New carpet in 2023 Full interior and exterior paint job in 2023
Getting Around
 Car-Dependent
 Very Limited Transit
 Somewhat Bikeable
Schools
Construction
Condition
- Property condition: Updated/Remodeled
- Year built: 1961
Materials
- Foundation: Slab
Type & Style
- Home type: SingleFamily
- Property subType: Single Family Residence
Interior
Bedrooms & Bathrooms
- Bedrooms: 4
- Bathrooms: 2
- Full bathrooms: 2
Features
- Flooring: Carpet
Heating & Cooling
- Heating features: Central,Natural Gas
- Cooling features: Central Air,Electric
Interior Area
- Total structure area: 1,894
- Total interior livable area: 1,894 sqft
Property
Details
- Parcel number: 1529000002501100
Features
- Levels: One
- Exterior features: Storage
Lot
- Lot size: 6,534 sqft
- Features: Interior Lot
Climate Risk is Financial Risk
Every home has a financial story beyond the listing price. Below, you’ll see the climate risks that could affect this property — and in Bills & Affordability, how those risks may influence repairs, insurance, utilities, and long-term value.
Biggest Threats for This Home
- Lightning

- Winter Weather

- Hail

- Heat Wave

- Cold Wave

- Inland Flooding

- Strong Wind

- Tornado

How This Home’s Risks Compare
FEMA Declared Disasters Across Texas Counties
Understanding the Costs
Financial advisors generally recommend spending no more than 30% of your gross household income on housing costs. In practice, many households stretch to 35% or beyond — especially in high-cost markets.
Estimated Costs Today
| Monthly | Annual | |
|---|---|---|
| Mortgage | $955 | $11,460 |
| Home Insurance * | $177 | $2,124 |
| Property Taxes | $294 | $3,528 |
| Electricity | $238 | $2,859 |
| Total | $1,664 | $19,968 |
Income You'd Need if You Spent...
Texas FAIR Plan Programs

How Costs Could Change Over Time
Climate risk is quickly impacting all of the major home ownership costs. Adjust the growth rates and percentage of income spent on housing below to see how your housing costs could change over the next 10 years — and what income you'd need to keep up.
Comparing Against the Market
Price Per Sq Ft
vs Other Active Listings
Avg $/sqft
vs Homes Sold Last Month
Median $/sqft
Current Market Trends
Median Price Per Square Foot
The median price per square foot of homes sold in this area each month. Compare this to this listing's price per square foot to gauge whether the home is priced in line with recent sales.
Historicals for This Listing
Zestimate History ($/sqft)
Price History
| Date | Event | Price |
|---|---|---|
| 2026-04-18 | Price change | $198,000 |
| 2026-03-18 | Listed for sale | $205,000 |
 View on Zillow