

1304 Sea Island Rd, San Angelo, TX, 76904
About This Home
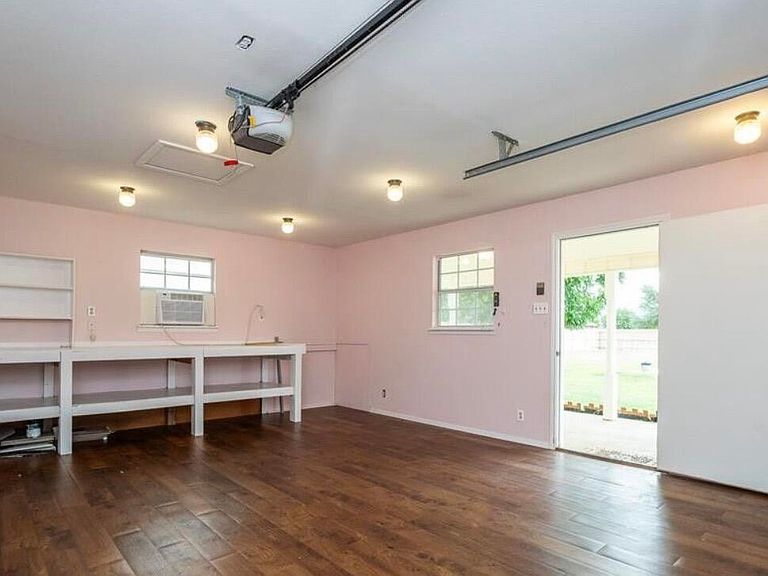
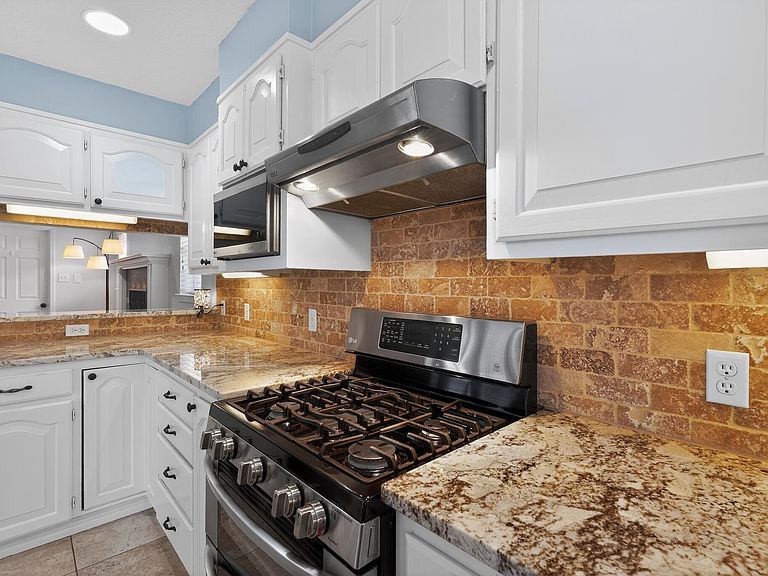
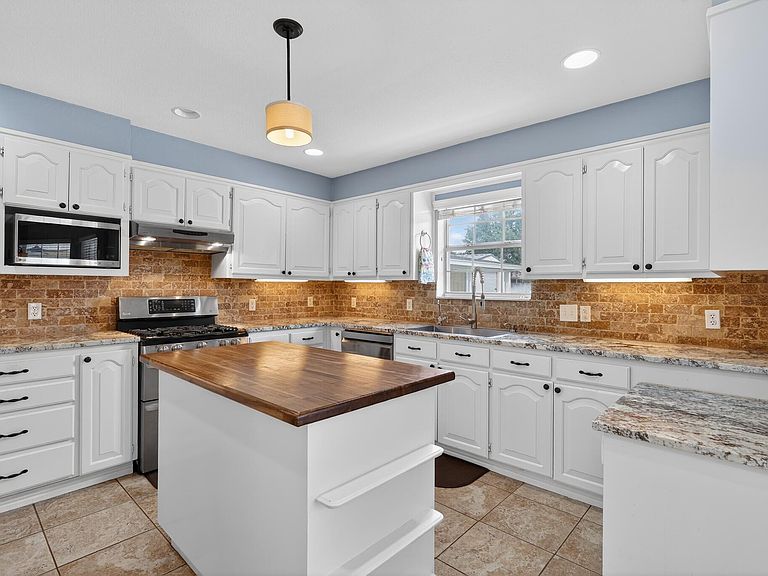
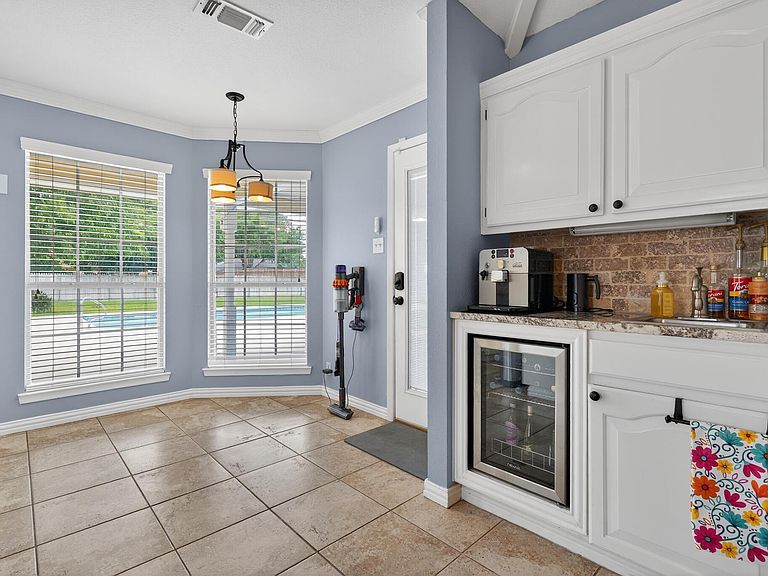
Located in desirable Country Club Lake Estates, this move-in ready 5-bedroom, 2.5-bath home is approximately 2,500 sq. ft. on over half an acre. Features include a versatile 5th bedroom/flex room with projector and screen, wood-burning fireplace, reverse osmosis drinking water system, water softener, Cove security system, keyless entry, and a new water heater (2026). The upgraded kitchen boasts granite countertops, gas stove, coffee/wine bar with sink, and wine refrigerator. Included are a 2024 refrigerator, dishwasher, washer, and dryer. Outside you'll find an in-ground pool, sprinkler system supplied by a private well, city water to the home, fenced yard, detached garage/workshop, and storage shed with built-in shelving for 28 HDX storage containers. Pool equipment conveys. Conveniently located near fishing, shopping, dining, and schools. A rare combination of space, storage, and amenities in one of San Angelo's most desirable neighborhoods.
Getting Around
 Car-Dependent
 Very Limited Transit
 Somewhat Bikeable
Schools
Construction
Condition
- Year built: 1993
Materials
- Foundation: Slab
- Roof: Composition
Type & Style
- Home type: SingleFamily
- Property subType: Single Family Residence
Interior
Bedrooms & Bathrooms
- Bedrooms: 5
- Bathrooms: 3
- Full bathrooms: 2
- 1/2 bathrooms: 1
Heating & Cooling
- Heating features: Central,Propane
- Cooling features: Central Air,Wall/Window Unit(s)
Interior Area
- Total structure area: 2,501
- Total interior livable area: 2,501 sqft
Property
Details
- Parcel number: 0719450000803200
Features
- Private pool: Yes
- Pool features: In Ground
Lot
- Lot size: 0.61 Acres
Parking
- Total spaces: 3
- Parking features: Detached,Garage
- Has garage: Yes
- Attached garage spaces: 3
- Covered spaces: 3
Climate Risk is Financial Risk
Every home has a financial story beyond the listing price. Below, you’ll see the climate risks that could affect this property — and in Bills & Affordability, how those risks may influence repairs, insurance, utilities, and long-term value.
Biggest Threats for This Home
- Winter Weather

- Hail

- Inland Flooding

- Lightning

- Cold Wave

- Drought

- Heat Wave

- Strong Wind

- Tornado

- Wildfire

How This Home’s Risks Compare
FEMA Declared Disasters Across Texas Counties
Understanding the Costs
Financial advisors generally recommend spending no more than 30% of your gross household income on housing costs. In practice, many households stretch to 35% or beyond — especially in high-cost markets.
Estimated Costs Today
| Monthly | Annual | |
|---|---|---|
| Mortgage | $2,629 | $31,548 |
| Home Insurance * | $400 | $4,800 |
| Property Taxes | $445 | $5,340 |
| Electricity | $274 | $3,295 |
| Total | $3,748 | $44,976 |
Income You'd Need if You Spent...
Texas FAIR Plan Programs
How Costs Could Change Over Time
Climate risk is quickly impacting all of the major home ownership costs. Adjust the growth rates and percentage of income spent on housing below to see how your housing costs could change over the next 10 years — and what income you'd need to keep up.
Comparing Against the Market
Price Per Sq Ft
vs Other Active Listings
Avg $/sqft
vs Homes Sold Last Month
Median $/sqft
Current Market Trends
Median Price Per Square Foot
The median price per square foot of homes sold in this area each month. Compare this to this listing's price per square foot to gauge whether the home is priced in line with recent sales.
Historicals for This Listing
Zestimate History ($/sqft)
Price History
| Date | Event | Price |
|---|---|---|
| 2026-05-29 | Listed for sale | $520,000 |
| 2024-09-03 | Sold | -- |
| 2024-08-12 | Price change | $515,000 |
| 2024-07-31 | Price change | $525,000 |
| 2024-07-06 | Price change | $535,000 |
| 2024-06-20 | Listed for sale | $540,000 |
| 2024-06-15 | Listing removed | $540,000 |
| 2024-05-16 | Listed for sale | $550,000 |
| 2017-09-27 | Sold | -- |
| 2017-08-04 | Listed for sale | $329,500 |
| 2012-02-16 | Sold | -- |
| 2011-11-23 | Price change | $249,000 |
| 2011-10-21 | Price change | $259,000 |
| 2011-09-27 | Listed for sale | $272,500 |
 View on Zillow