

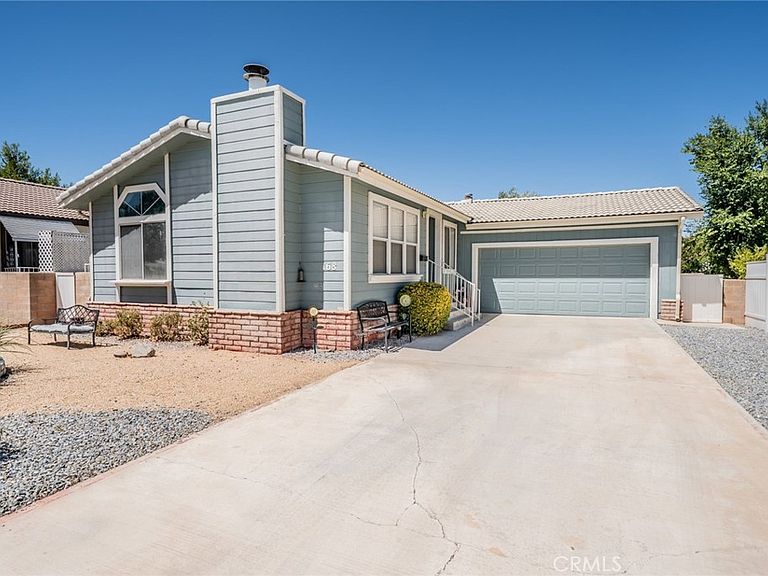


22241 Nisqually Rd Spc 168, Apple Valley, CA, 92308
About This Home
Welcome to 22241 Nisqually Rd #168 in Apple Valley! Located in a desirable 55+ gated community, this charming 3-bedroom manufactured home offers comfortable High Desert living with the bonus of an attached 2-car garage. Step inside to a bright, open floor plan featuring vaulted ceilings, attractive wood-look flooring, and a cozy fireplace, creating a warm and inviting living space. The spacious kitchen offers abundant cabinetry and counter space, a convenient breakfast bar and adjoining dining area, making it easy to entertain or enjoy everyday meals. An additional bonus/office area provides flexible space for a home office, hobby room, or sitting area. The home also features indoor laundry with overhead storage, central heating and air conditioning, and a primary bedroom with an adjoining bath and a step-in shower. Outside, enjoy a low-maintenance, fenced yard with mature landscaping, an established shade tree, and plenty of room to create your own relaxing outdoor retreat. And the community is a destination all its own! Residents can enjoy planned social activities, a clubhouse, swimming pool, tennis court, dog park, walking paths, picnic and gathering areas, beautifully maintained grounds, and gorgeous High Desert mountain views. Conveniently located near shopping, dining, medical services, and everyday necessities. Comfort, convenience and community all come together in this wonderful Apple Valley home. Come see why #168 may be the perfect place for your next chapter. Call to schedule a tour today!!!
Getting Around
 Car-Dependent
 Some Transit
 Somewhat Bikeable
Schools
Construction
Condition
- Year built: 1990
Type & Style
- Home type: MobileManufactured
- Property subType: Manufactured Home
Interior
Appliances
- Appliances included: Dishwasher,Gas Oven,Gas Range,Gas Water Heater,Dryer,Washer
- Laundry features: Washer Hookup,Gas Dryer Hookup,Inside
Bedroom
- Features: All Bedrooms Down
Bedrooms & Bathrooms
- Bedrooms: 3
- Bathrooms: 2
- Full bathrooms: 2
Features
- All Bedrooms Down,Main Level Primary,Primary Suite
Heating & Cooling
- Heating features: Central
- Cooling features: Central Air
Interior Area
- Total interior livable area: 1,344 sqft
Master Bedroom
- Features: Main Level Primary
Master Bedroom
- Features: Primary Suite
Property
Details
- Parcel number: 3087541016168
- On leased land: Yes
- Lease amount: 845
- Special condition: Standard
Features
- Levels: One
- Stories: 1
- Entry location: Nisqually
- Pool features: Community,Fenced,In Ground
- Has view: Yes
- View description: Desert,Mountain(s)
Lot
- Features: 0-1 Unit/Acre
Parking
- Total spaces: 2
- Parking features: Concrete,Direct Access,Door-Single,Driveway,Garage Faces Front,Garage
- Has garage: Yes
- Attached garage spaces: 2
- Covered spaces: 2
Climate Risk is Financial Risk
Every home has a financial story beyond the listing price. Below, you’ll see the climate risks that could affect this property — and in Bills & Affordability, how those risks may influence repairs, insurance, utilities, and long-term value.
Biggest Threats for This Home
- Earthquake

- Inland Flooding

- Wildfire

- Heat Wave

- Landslide

How This Home’s Risks Compare
FEMA Declared Disasters in San Bernardino County and California
Understanding the Costs
Financial advisors generally recommend spending no more than 30% of your gross household income on housing costs. In practice, many households stretch to 35% or beyond — especially in high-cost markets.
Estimated Costs Today
| Monthly | Annual | |
|---|---|---|
| Mortgage | $834 | $10,008 |
| Home Insurance * | $58 | $696 |
| Property Taxes | $185 | $2,220 |
| Electricity | $398 | $4,786 |
| Total | $1,475 | $17,700 |
Income You'd Need if You Spent...
California FAIR Plan Programs
How Costs Could Change Over Time
Climate risk is quickly impacting all of the major home ownership costs. Adjust the growth rates and percentage of income spent on housing below to see how your housing costs could change over the next 10 years — and what income you'd need to keep up.
Comparing Against the Market
Price Per Sq Ft
vs Other Active Listings
Avg $/sqft
vs Homes Sold Last Month
Median $/sqft
Current Market Trends
Median Price Per Square Foot
The median price per square foot of homes sold in this area each month. Compare this to this listing's price per square foot to gauge whether the home is priced in line with recent sales.
Historicals for This Listing
Zestimate History ($/sqft)
Price History
| Date | Event | Price |
|---|---|---|
| 2026-08-07 | Listed for sale | $165,000 |
| 2021-02-26 | Listing removed | -- |
| 2020-12-02 | Price change | $128,000 |
| 2020-10-30 | Listed for sale | $124,000 |
| 2020-05-21 | Listing removed | $129,000 |
| 2020-03-31 | Listed for sale | $129,000 |
| 2014-12-31 | Listing removed | $38,900 |
| 2014-12-06 | Pending sale | $38,900 |
| 2014-10-14 | Listed for sale | $38,900 |
 View on Zillow