

12186 Roselawn St, Detroit, MI, 48204
About This Home
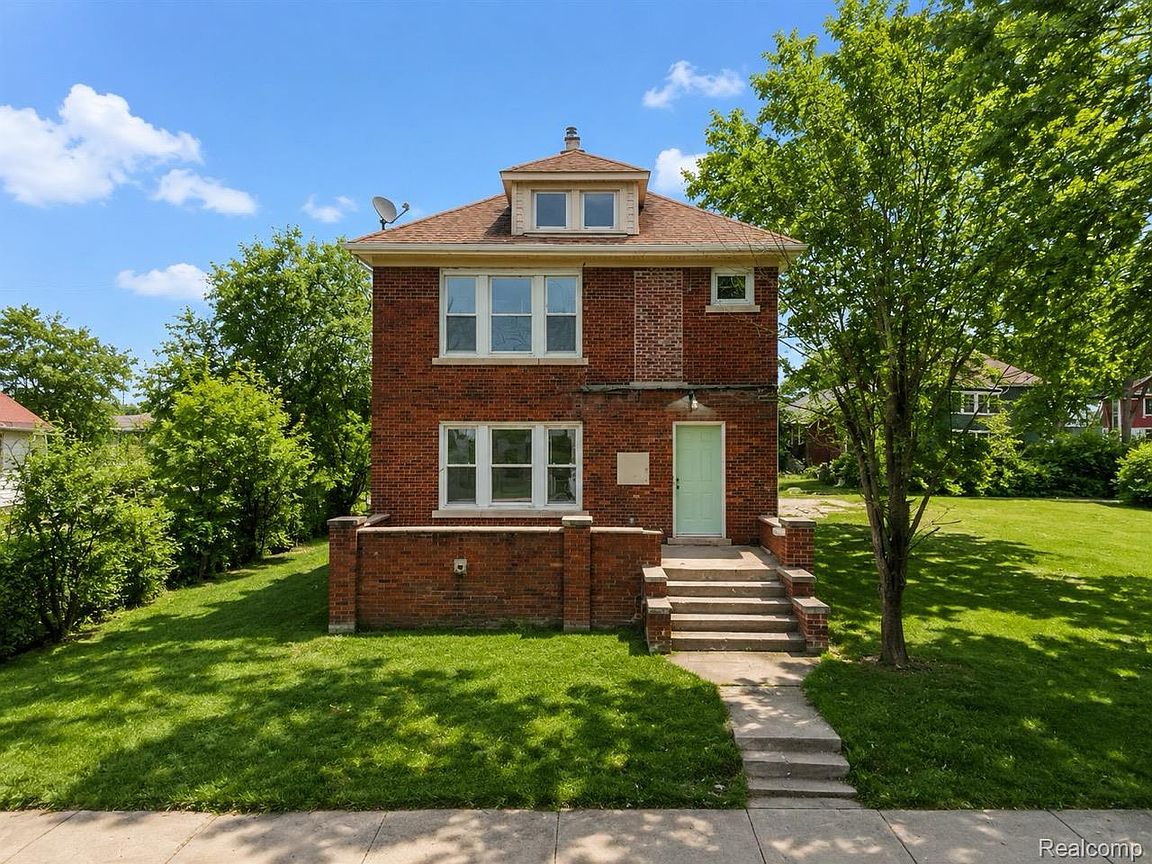
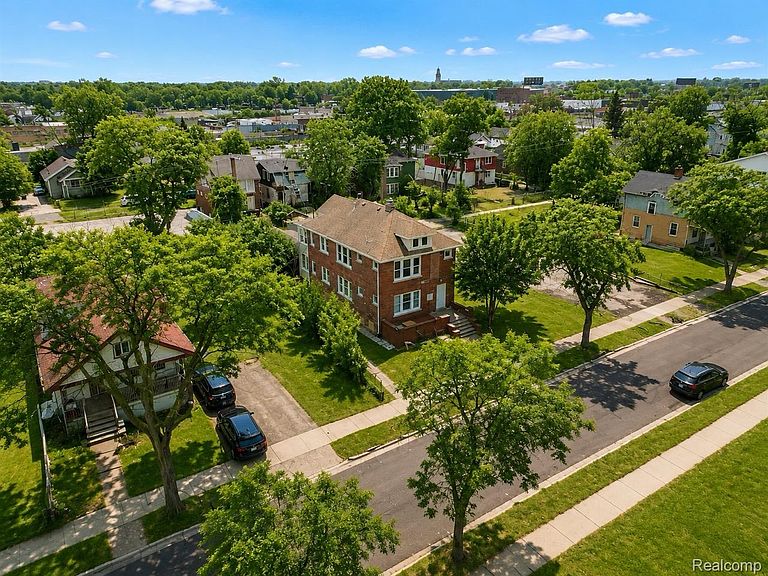
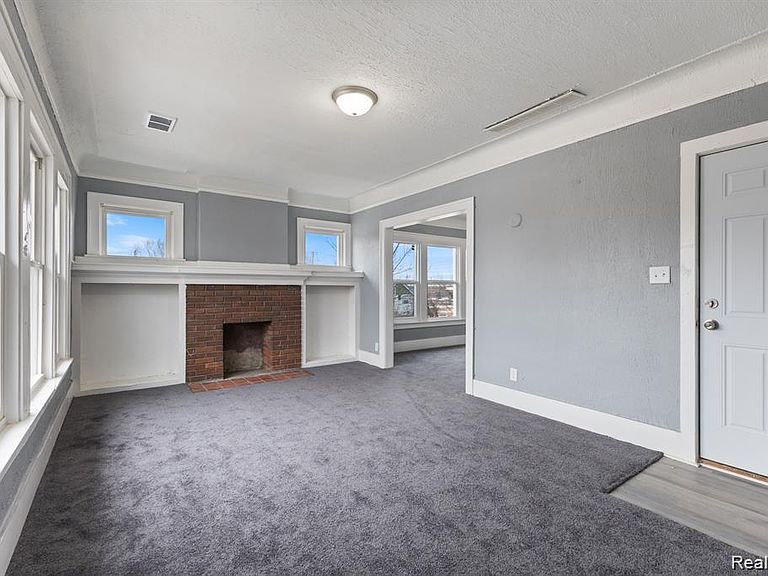
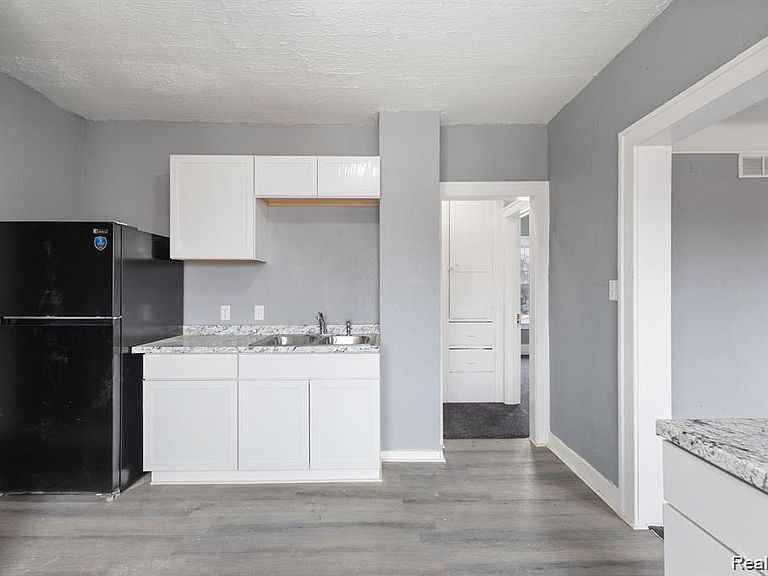
Here's a rare investor opportunity - a fully updated duplex with both units occupied by Section 8 tenants backed by the government. This Detroit duplex features two 2-bedroom, 1-bath units, both currently rented through Section 8 at $1,150/month and $950/month, for a total monthly rent roll of $2,100/month and $25,200/year in gross scheduled income. The property has been recently refreshed, helping reduce near-term maintenance concerns and support tenant retention. Updates include brand-new vinyl windows, fresh paint throughout, new plush carpeting, updated kitchen cabinets and countertops, and new furnaces for improved efficiency and reliability. From a buy-and-hold perspective, this asset checks several important boxes: two occupied units, Section 8 rental income, separate income streams, updated interiors, and major mechanical improvements already completed. The duplex setup also helps reduce reliance on a single tenant, while the 2-bedroom unit mix remains practical and rentable in Detroit’s investor market. Priced at $170,000, the property offers an attractive 14.8% gross rent-to-price return and a 1.24% monthly rent-to-price ratio. For DSCR buyers, the current rent roll creates strong debt coverage potential. Based on a typical 75% LTV scenario, the estimated loan amount would be approximately $127,500, giving investors a solid income base to work with. Final DSCR will depend on lender rate, taxes, insurance, and underwriting, but the rental income is compelling for investors looking for cash-flowing Section 8 product. For investors seeking immediate rental income, DSCR potential, and strong gross rent performance at a reasonable price point, this duplex deserves a serious look. Please do not disturb tenants. Showings available with accepted full-list offer only.
Getting Around
 Car-Dependent
 Some Transit
 Somewhat Bikeable
Schools
Construction
Condition
- Year built: 1923
Materials
- Foundation: Basement,Block
- Construction materials: Brick
Notable Dates
- Major remodel year: 2025
Type & Style
- Home type: MultiFamily
- Architectural style: Duplex
- Property subType: Duplex
Interior
Basement
- Has basement: Yes
- Basement: Unfinished
Bedrooms & Bathrooms
- Bedrooms: 4
- Bathrooms: 2
- Full bathrooms: 2
Features
- Finished area above ground: 2,450
Heating
- Heating features: Forced Air,Natural Gas
Interior Area
- Total interior livable area: 2,450 sqft
Property
Details
- Parcel number: W16I030132S
- Zoning description: Residential
- Special condition: Short Sale No,Standard
Features
- Levels: Two
- Stories: 2
- Pool features: None
Lot
- Lot size: 3,920 sqft
- Lot size dimensions: 35 x 106
Climate Risk is Financial Risk
Every home has a financial story beyond the listing price. Below, you’ll see the climate risks that could affect this property — and in Bills & Affordability, how those risks may influence repairs, insurance, utilities, and long-term value.
Biggest Threats for This Home
- Cold Wave

- Heat Wave

- Inland Flooding

- Strong Wind

- Tornado

- Tsunami

How This Home’s Risks Compare
FEMA Declared Disasters in Wayne County and Michigan
Understanding the Costs
Financial advisors generally recommend spending no more than 30% of your gross household income on housing costs. In practice, many households stretch to 35% or beyond — especially in high-cost markets.
Estimated Costs Today
| Monthly | Annual | |
|---|---|---|
| Mortgage | $783 | $9,396 |
| Home Insurance * | $496 | $5,952 |
| Property Taxes | $189 | $2,268 |
| Electricity | $267 | $3,206 |
| Total | $1,735 | $20,820 |
Income You'd Need if You Spent...
Michigan FAIR Plan Programs


How Costs Could Change Over Time
Climate risk is quickly impacting all of the major home ownership costs. Adjust the growth rates and percentage of income spent on housing below to see how your housing costs could change over the next 10 years — and what income you'd need to keep up.
Comparing Against the Market
Price Per Sq Ft
vs Other Active Listings
Avg $/sqft
vs Homes Sold Last Month
Median $/sqft
Current Market Trends
Median Price Per Square Foot
The median price per square foot of homes sold in this area each month. Compare this to this listing's price per square foot to gauge whether the home is priced in line with recent sales.
Historicals for This Listing
Zestimate History ($/sqft)
Price History
| Date | Event | Price |
|---|---|---|
| 2026-07-02 | Price change | $155,000 |
| 2026-06-29 | Price change | $160,000 |
| 2026-06-19 | Listed for sale | $170,000 |
| 2025-08-08 | Sold | $135,000 |
| 2025-07-18 | Pending sale | $159,990 |
| 2025-06-04 | Price change | $159,990 |
| 2025-05-18 | Price change | $165,000 |
| 2025-05-01 | Price change | $175,000 |
| 2025-04-24 | Listed for sale | $200,000 |
 View on Zillow