

Attainability fatigue is what Denver-area realtors are calling the exhaustion buyers feel even as prices track close to historical norms. It's not really about the sticker price — it's the weight of insurance, taxes, utilities, and HOA costs stacked on top of it, and a real share of that weight is climate-driven, not generic inflation.
If you've been quietly circling the idea of buying a home for a while now — not really searching, just watching — you've probably noticed something that doesn't quite add up. The market doesn't look broken. Prices aren't spiking. And yet actually pulling the trigger feels harder than it should. Denver-area realtors have a name for that feeling now: attainability fatigue.
Why Are Buyers Pulling Back in a Market That Isn't Actually Overpriced?
Denver home prices are tracking close to their long-run historical norm — the sticker price isn't what's driving buyers away.
The clearest sign is how few buyers are even showing up to look. According to InfoSparks data cited in the Denver Metro Association of Realtors' (DMAR) own June 2026 report, the average Denver Metro listing drew 14.2 showings a month back in May 2021. By May 2026, that number had fallen to just 4.7 — showing activity down by nearly two-thirds in five years, even as the number of homes for sale has stayed roughly typical for the season.
Meanwhile, the cost of actually carrying a home has kept climbing. Colorado moved up nine spots to No. 18 in Realtor.com's 2026 Housing Report Card, and even that improvement came with a catch: a typical Colorado home now requires about 41.4% of household income to afford, well past the 30% mark lenders have long used as the line for "house poor." Year-to-date new listings are down 5.55%, too — sellers aren't convinced it's worth the effort to list, either.
It's not hitting every segment the same way. Detached homes in Denver Metro closed at a median $675,000 in June, still up modestly year-over-year. Attached homes — condos and townhomes — closed at a median $391,750, actually down 2% year-over-year, a segment DMAR describes as increasingly weighed down by deferred maintenance and rising HOA-related costs. The Market Trends Committee's own read on it: buyers have stopped treating a home purchase as a one-time price tag and started running the math on what it costs to hold onto the place for the next decade — before they'll put in an offer.
This is what realtors mean by attainability fatigue: buyers running the long-term math nobody's showing them, then walking away when it doesn't work.
How Much of That Weight Is Actually Climate Risk?
Insurance shaped by climate exposure makes up a growing piece of that stacked cost — and it's now visible in property values and even in where people choose to live, not just on a monthly bill.
Cotality's data shows the relationship directly: for every 10% increase in insurance premiums, property values drop roughly 4.6%. That's not a projection — John Rogers, Cotality's chief data and analytics officer, said on the record at the 2026 National Association of Real Estate Editors conference that the firm is seeing "very early signs that insurance premiums are having an effect on where people live." The same Cotality analysis of Census Bureau migration data found the Sun Belt states that drove pandemic-era relocation — Texas, Arizona, and Florida — have seen net migration turn negative, while migration is accelerating toward states less exposed to flood and extreme heat. The reason isn't schools or yard space. It's the cost of insuring a home in a climate-exposed market, which has stopped being an abstraction and started showing up directly in what people can actually afford to keep.
Colorado isn't in the same risk tier as the Gulf Coast or the Southwest. But the same mechanism is part of what's driving that 41.4%-of-income figure and the extra pressure on Denver's attached-home segment above — insurance and HOA costs shaped by climate exposure, layered on top of the mortgage payment, in a market where the purchase price itself looks perfectly normal.
How Do You See Your Own Number Before You're Priced Out on Paper Only?
The stacked cost of owning a specific home is knowable in advance — it doesn't have to stay invisible until after you've already closed.
That's the gap Quoll Homes was built to close. Every listing on QuollHomes.com shows the estimated monthly cost of actually owning that home — mortgage, insurance, property taxes, and utilities — along with a 10-year climate risk projection for that specific property. Not a national average. Not a rough estimate after the fact. The number, on the home you're actually considering, before you make an offer.
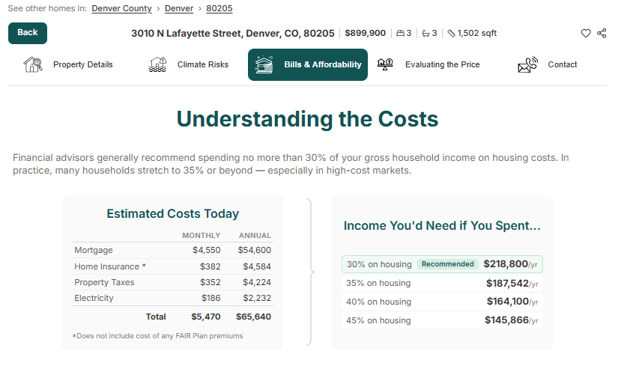
Insurance is the line that moves fastest. On the same chart, mortgage barely shifts over ten years while insurance climbs the steepest of any cost — and the income needed to keep up with all of it rises right along with it. It's the same gap between what a buyer budgets at closing and what they actually end up paying — just made visible instead of showing up gradually on the bills.
Search your market at QuollHomes.com to see it for yourself.
Frequently Asked Questions
What is "attainability fatigue"?
It's the term realtors are using to describe buyer exhaustion in markets where prices look normal by historical standards but the total cost of ownership — insurance, taxes, utilities, HOA fees — has climbed enough that buyers pull back anyway.
Why does buying a house feel unaffordable even when prices seem normal?
Because the sticker price isn't the whole picture. Insurance, taxes, utilities, and HOA costs stack on top of it, and a growing share of that stack is climate-driven — which is exactly the gap between what a home costs to buy and what it costs to actually keep.
Is attainability fatigue only happening in Denver?
No. Denver is a clear example because its prices are close to historical norms, which makes it easier to see that price isn't the real driver. The same stacking-cost dynamic is showing up in markets nationally, especially where insurance costs are climate-driven.
How much of rising homeownership costs is actually climate-related?
A meaningful and growing share. Cotality's research ties a 10% rise in insurance premiums to roughly a 4.6% drop in property values, and climate-driven insurance costs are now measurable enough to be reshaping migration patterns in the highest-risk states.
How can I find out what a home will really cost before I make an offer?
Quoll Homes shows the estimated monthly cost of ownership — mortgage, insurance, taxes, and utilities — along with a 10-year climate risk projection, on every listing at QuollHomes.com.
Read next: Is Climate Risk Now a Bigger Price Factor Than Interest Rates? · What "Home Insurance Deserts" Are · Home Buying Cost Breakdown
Sources: Denver Metro Association of Realtors (DMAR), Market Trends Report, June 2026 data · Realtor.com 2026 Housing Report Card (via DMAR) · InfoSparks (via DMAR) · Cotality